
Introduction
Download the full brief to explore what the data reveal about child care availability, enrollment, and open slots across greater Davidson County. Understanding local supply is the first step toward building a child care system that works for all families.
High-quality child care is an essential resource for families and children. Reliable child care enables parental workforce participation, simultaneously providing children with a safe, nurturing, and structured environment that promotes healthy development.1 Quality child care also strengthens families’ economic stability, improving child development outcomes and promoting broader economic growth.2
Despite the essential need for child care, families across the United States face challenges accessing it.3 Though the lack of access to child care is widespread across the country, the key to implementing effective solutions requires understanding the specific local challenges within states and regions.
United Way of Greater Nashville engaged the Prenatal-to-3 Policy Impact Center (Policy Impact Center) at Vanderbilt University to conduct the Davidson County Child Care Landscape Study. The purpose of the study is to collect localized data to understand the strengths and challenges of the greater Davidson County child care system.
In Davidson County, TN, which includes the capital city of Nashville, center-based child care is the most prevalent type of licensed care available to families with children under age 5.a, 4 This brief examines study findings related to the current supply and availability of center-based child care in greater Davidson County. This brief is one part of a five-part series presenting the findings of the Davidson County Child Care Landscape Study.
To gain insight into greater Davidson County’s child care supply, the Policy Impact Center developed and fielded a survey to all 246 reachable center-based child care programs in the region during the Summer of 2025. Of the reachable center-based programs, 47 percent (n=116) responded to the Davidson County Child Care Provider Experience Survey (Child Care Provider Survey) and provided sufficient information to be included in this analysis. The center-based analytic sample is largely representative of the overall population of child care centers. Throughout this brief, we use survey respondent results (n=116) to generate estimates of center-based child care supply at the population level (N=246), providing a new and detailed picture of the child care landscape across greater Davidson County.b
a Greater Davidson County has additional licensed child care options (e.g., home-based child care, drop-in child care, before and after school-only providers) that are excluded from the scope of this brief.
Background
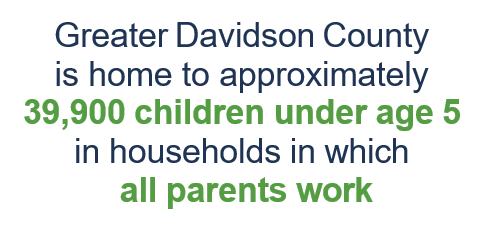
The greater Davidson County region is home to approximately 57,000 children under age 5, with a total population of approximately 900,000.5,6 Greater Davidson County has a racially and ethnically diverse population, with 58 percent of people in the region identifying as White, 22 percent identifying as Black, 12 percent identifying as Hispanic, and 8 percent identifying as another race or ethnicity.7 Currently, 17 percent of children under age 5 in this region live below the Federal Poverty Level, compared to 12 percent of the total population, indicating a higher concentration of economic hardship among families with young children.8 Approximately 70 percent, or 39,900 children, live in households in which all parents in the household are in the workforce.9
Families seeking formal child care often turn to local child care centers, or licensed early care and education programs that operate in nonresidential settings, because state licensing requirements and oversight help ensure consistent standards for child safety and program quality. Child care centers in Tennessee are overseen by one of two state agencies, either Tennessee Department of Human Services (TDHS) or Tennessee Department of Education (TDOE), which each set their own quality parameters and oversight processes.10
Greater Davidson County’s child care capacity likely falls short of meeting the needs of families across various backgrounds. Previous Policy Impact Center research on greater Davidson County suggests that an estimated 47 percent of all local children under age 5 live in areas that could be considered child care deserts, or areas in which children outnumber licensed child care slots by a rate of at least 3 to 1.11 These mismatches between child care supply and the population of young children can impact families’ ability to find care that aligns with their needs and preferences.
Further, child care shortages also often disproportionately impact families that do not identify as White, families with low and middle income levels, and families with infants and toddlers.12 Importantly, child care desert estimates rely on state licensing data as a proxy for available care, which often overstate the number of slots programs can actually make available to families, given program staffing and the age of children served.13
Publicly available state licensing data provide an important starting point for understanding child care supply in greater Davidson County.14 However, licensing data describe the maximum number of children programs are authorized to serve and often do not capture how child care programs operate in practice, including important nuances related to the exact number or type (e.g. infant, certificate-accepting) of child care slots actually available to families.15 Programs may operate below licensed capacity, allocate slots differently across age groups, or vary in how many slots they make available to families using child care certificates. As a result, licensing data alone provide an incomplete measure of the child care supply families can realistically access when looking for care.
By presenting data collected from child care directors on actual child enrollment, open slots, and other key measures of child care supply at child care centers across the region, the following findings build a more complete understanding of child care supply in greater Davidson County.
b To review the complete methodology and approach for the Davidson County Child Care Landscape Study, refer to the online Methods Appendix.
Greater Davidson County Child Care Centers Have 22,184 Slots For Children Ages Birth to 5 Years Old
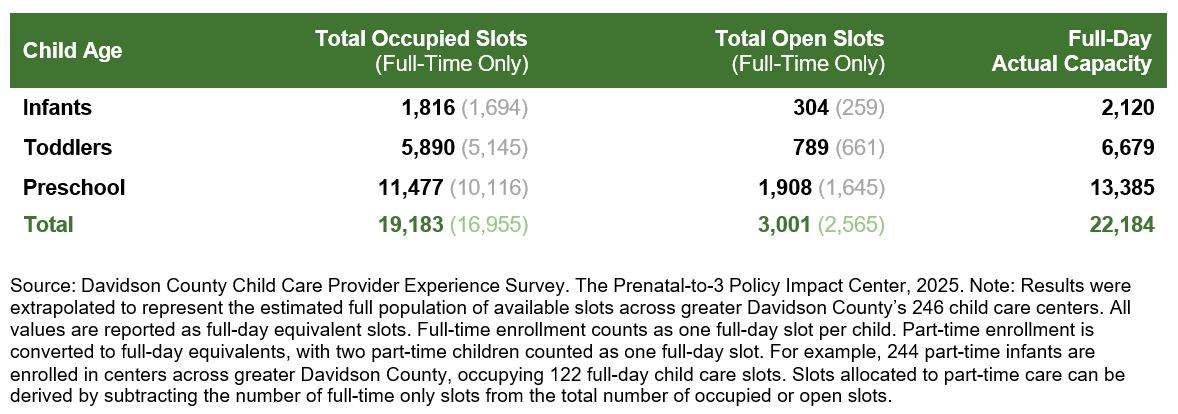
In the Child Care Provider Survey, we asked child care center directors to report the number of children currently enrolled and the number of slots that are currently open in their program today. Using these survey responses, we estimate that across the 246 centers in greater Davidson County, 19,183 full-day equivalent child care slots are occupied by children under age 5, with the vast majority of slots filled by children who are enrolled in full-time care (see Figure 1).
Additionally, we estimate that a total of 3,001 full-day equivalent slots are open, or unoccupied, and similarly are primarily offered as full-time slots (see Figure 1). Full-day equivalent child care slots can either be allotted to one child using full-time care or allotted to more than one child using part-time care. To create a comparable measure of slots across child care providers and across the region, we measure part-time slots as full-day equivalent slots.
Together, occupied and open slots represent the region’s full-day actual capacity, or the total number of full-day slots available to children, as reported by child care directors on the survey. In total, the greater Davidson County area has a full-day actual capacity of 22,184 child care slots, with 86 percent of actual capacity currently in use (occupied slots) and 14 percent open to families seeking child care (open slots; see Figure 1).
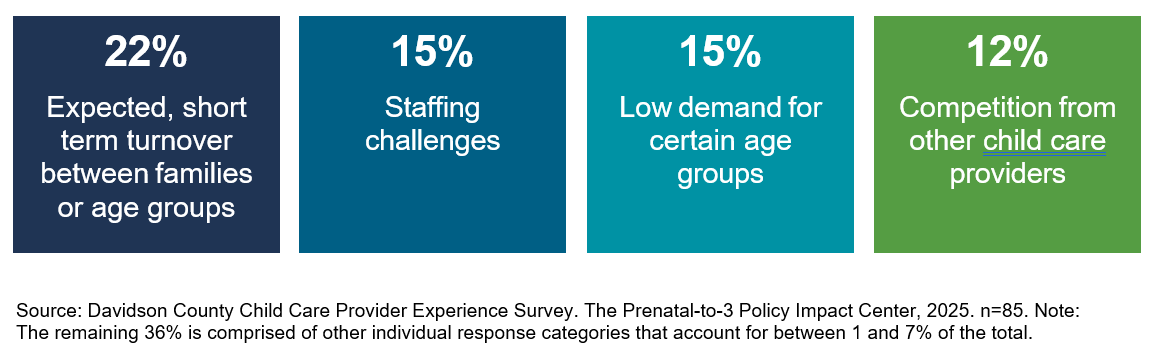
Survey responses indicate several reasons why child care programs have open slots. Most commonly, programs report they have open slots because of short-term, expected turnover between enrollments, indicating temporary gaps in enrollment as children move in and out of care. See Figure 2 for the top four most commonly reported reasons programs say they currently have open slots.
Child Care Centers Operate at 78% of Their Licensed Capacity For Children Ages Birth to 5
Child care programs often cannot or do not operate at their full licensed capacity. Licensed capacity is a measure of the maximum number of children that can be present at a program at one time, as determined by state regulations during the licensing process. For many programs, licensed capacity functions as a regulatory ceiling rather than an enrollment target.
In greater Davidson County, child care centers are licensed to serve a total of 28,336 slots. Today, however, based on Child Care Provider Survey data, we find that only 22,184 slots are either currently enrolled by or open to children age birth to 5, meaning that the local child care system currently operates at an estimated full-day actual capacity of 78 percent of total licensed capacity for children up to Kindergarten. In other words, just over 6,000 licensed child care slots are inaccessible to families with children under age 5 seeking center-based child care.
Many programs also use some of their licensed capacity to provide before and after school care and/or summer and holiday care to school age children. If you consider occupied and open slots for school age children as well, the greater Davidson County child care system currently operates at 83 percent of its licensed capacity.
Child care programs operate with a full-day actual capacity of occupied and open slots that is lower than their licensed capacity for a number of reasons. Each age group has differing required educator-to-child ratios and maximum group sizes, and thus depending on how programs use their classroom spaces for different age groups, they may be limited by these maximum group sizes beyond their licensed capacity. Or, programs could face issues hiring and retaining staff that prevent them from offering as many slots as they otherwise could, or may just prefer to keep their programs smaller.
Most Child Care Centers Do Not Want to Change the Number of Slots They Currently Allocate to Infants, Toddlers, or Preschoolers
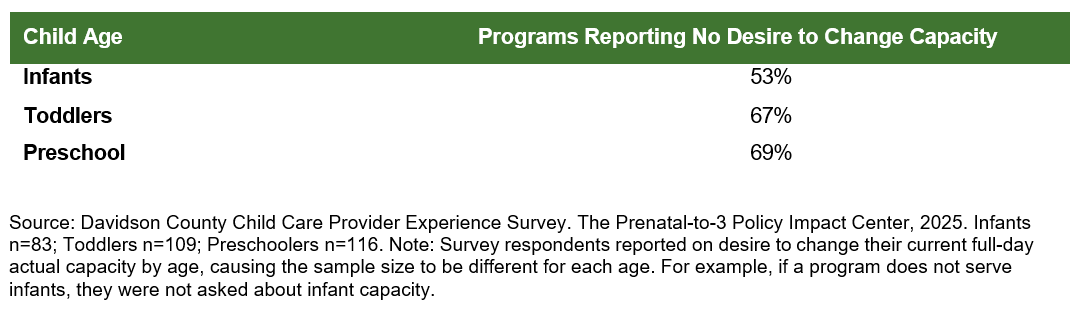
Through the Child Care Provider Survey, greater Davidson County child care directors weighed in on how they would change the number of slots they offered to each age group they currently serve assuming they had adequate staffing and resources. These results can build an understanding of the extent to which existing providers in greater Davidson County could potentially provide additional child care capacity, versus relying on new providers to increase capacity. Results indicate that most programs would continue offering the same number of slots for each age group even with adequate staffing and resources. Across all age groups, more than half of survey respondents report that they would not want to change anything about the number of children they serve within each age group (see Figure 3).
Of programs that indicated a desire to change full-day actual capacity for at least one age group, most reported that they would want to increase their capacity to serve more children. When asked in the Child Care Provider Survey what factors limit their ability to increase their capacity to their ideal number of children, programs most frequently identified hiring and retention challenges, competition from public pre-K programs, and the overall costs of routine expenses as their primary barriers.
Overall, the number of children a program currently serves and their desire to serve fewer or more children may be influenced by a variety of factors, including program design choices, age group distributions, staffing challenges, resource constraints, and other operational considerations.
Full-day actual capacity is unlikely to equal licensed capacity precisely, because of the many differences in group sizes and ratios by child age. These results indicate that full-day actual capacity in greater Davidson County could be increased somewhat to get closer to licensed capacity if center-based programs experienced fewer staffing, pre-k competition, and cost challenges. However, most programs are currently satisfied with the number of children they serve in each age group, indicating room for growth is limited. Efforts to increase greater Davidson County’s child care supply may benefit from a multifaceted approach that includes adding new providers to the market as well as identifying opportunities to expand the number of slots among some existing providers.
Child Care Centers Can Serve Just Over Half of Children Under Age 5 in Working Families
Among the approximately 57,000 children ages birth to 5 in greater Davidson County, an estimated 70 percent, or approximately 39,900 children, live in households in which all parents are in the workforce according to the US Census Bureau. Through the estimated 22,184 slots accessible to families today, child care centers could serve a maximum of 56 percent of local children ages birth to 5 with all parents in the workforce.
In reality, not every child with all parents working will need or want a center-based child care slot, and not every child attending center-based care will have all parents in the workforce; however, the gap between supply and potential demand suggests that many working families face limited access to full-time child care options that meet their needs and preferences.c This gap is further illuminated by the prevalence of waitlists among child care centers, with 88 percent of surveyed centers waitlisting or turning away at least one child because of lack of capacity in the past 6 months. As a result, some families may need to rely on unstable child care arrangements that disrupt work or, in some cases, drive them to exit the workforce altogether.16
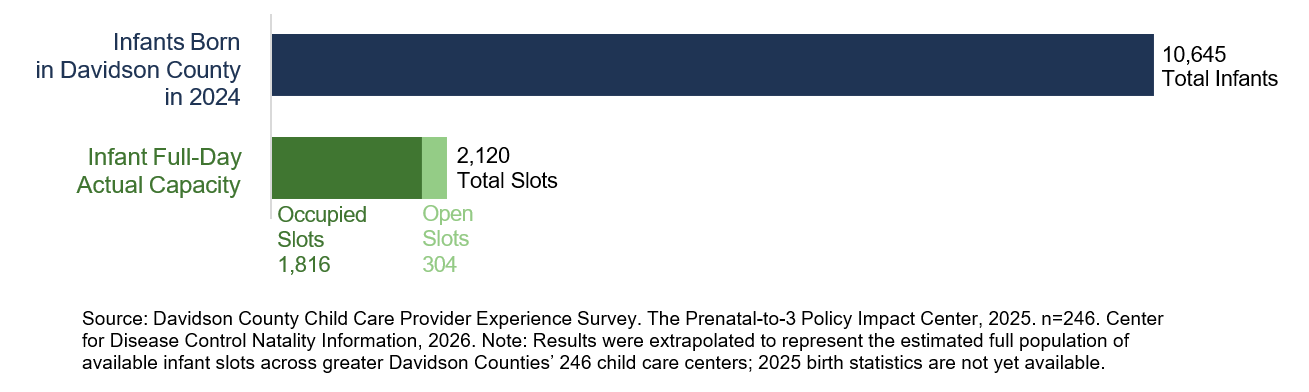
Infant Care Is Limited; Child Care Centers Can Serve Only 1 in 5 Infants Born in the Last Year
Infant care represents a small share of greater Davidson County’s child care capacity. Based on Child Care Provider Survey responses, of the 19,183 occupied slots, 1,816 slots (10%) are allocated to infants (see Figure 1). A similar pattern holds for open slots: of the 3,001 open slots, 10 percent are allocated to infants, meaning that just 10 percent of all full-day actual capacity serves the region’s youngest children. Thirty percent of all full-day actual capacity is allocated to toddlers, and the remaining 60 percent is allocated to preschoolers. For comparison, an analysis of 19 states that identify licensed capacity by age shows that statewide licensed capacity specifically allocated to infants can range from 1 to 23 percent.d,17
In 2024, according to national data from the Centers for Disease Control and Prevention, 10,645 infants were born in Davidson County.e,18 Based on current full-day actual capacity, the center-based child care system can only serve approximately 20 percent, or 1 in 5, infants born in the last year (see Figure 4).
d Tennessee does not identify licensed capacity by age and is not included in this analysis.
e 2025 birth statistics are not yet available.
Approximately Two-Thirds of Child Care Centers Accept Certificates, Accounting for 15% of Full-Time Enrollment
Many families in greater Davidson County may find child care costs unaffordable, leading some to seek support through Tennessee’s Child Care Certificate Program, which provides financial assistance, or subsidized child care, to help make care more affordable for families with low or moderate incomes in which parents are working or enrolled in education or training programs.f,22,23 Child care programs can make an operational decision on whether they want to participate in the Child Care Certificate Program and currently 66 percent of centers in greater Davidson County accept child care certificates.24
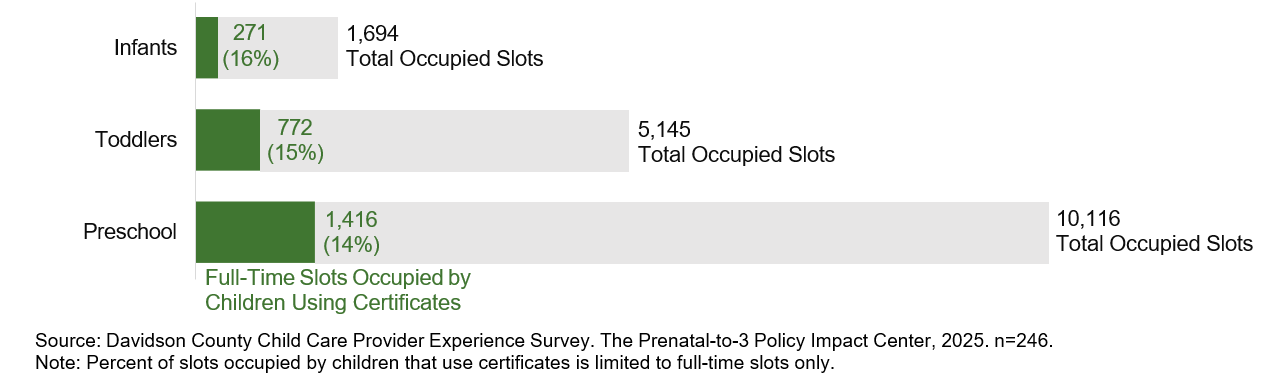
We asked programs to tell us how many of their occupied full-time slots are filled by children using certificates. Based on these Child Care Provider Survey responses, we estimate that among the 16,955 child care slots occupied by full-time children across all child care centers in the region, 15 percent use certificates to help cover the cost of child care tuition. The proportion of slots supported by certificates is similar across all age groups. Certificates currently support 16 percent of enrolled full-time infant slots, 15 percent of toddler slots, and 14 percent of preschool slots (see Figure 5).
Moreover, in Tennessee, as in most states, eligibility for a child care certificate does not guarantee that families receive tuition assistance. Based on US Census Bureau data, of all the children ages birth to 5 in the region, an estimated 48 percent, or approximately 27,000 children under 5, are income-eligible to receive a child care certificate.25 The exact number of slots that providers would be willing to offer to children whose families use certificates is unknown. Further, centers that could potentially accommodate more families using certificates may not be located in areas that are reasonably accessible to them. However, the number of income-eligible children far outnumbers even the total number of occupied or open child care slots in the region (~22,000), identifying likely gaps in the region’s ability to meet the child care needs of certificate-eligible families.
Additionally, since data collection for this study concluded, Tennessee has experienced reductions in federal child care funding, including an approximately $44.5 million decrease in its Child Care Development Fund (CCDF) annual allocation. Funding cuts have affected certificate structures, including introducing a 5 percent co-pay for all families based on income and implementing a waitlist, further complicating income-eligible families’ ability to access certificates.26
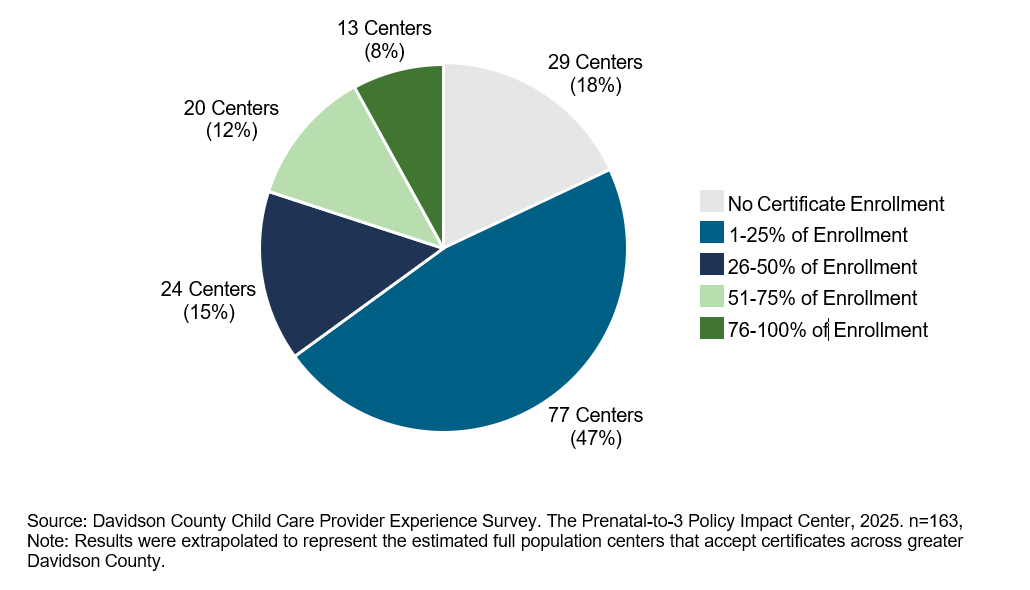
State funding and regional capacity are not the only factors that may impact child care access for families that receive a certificate. In greater Davidson County, although the majority of child care centers accept certificates (according to state licensing data), data from the Child Care Provider Survey illustrates that the percentage of full-time occupied slots filled by children using certificates varies widely by program. We estimate that 18 percent of the 163 certificate-accepting centers currently have no full-time slots occupied by a child using certificate, based on our population-level estimates derived from Child Care Provider Survey responses. The largest share of centers, 47 percent, serves a relatively small share of children with certificates, or at least one child but less than a quarter of full-time slots occupied by children using certificates (see Figure 6). Approximately 20 percent of centers serve more than half of children with certificates.
Figure 6: Share of Full-Time Enrollment Occupied by Children Who Use Certificates Among Centers that Accept Certificates
f At the 75th percentile in Davidson County, current monthly center-based child care tuition is estimated at $1,645 for infants $1,537 for toddlers, and $1,382 for preschoolers. See Brief 4 for more information about the cost of center-based child care and current certificate reimbursement rates.
Families eligible for child care certificates may face a twofold barrier when seeking child care: state funding limitations restrict access to certificates, and limited capacity within programs that accept certificates may further constrain families’ ability to secure child care.
Conclusion
Center-based child care accounts for the vast majority of the child care supply in greater Davidson County, yet overall full-day actual capacity among centers may be limited compared to the number of families with young children seeking care. Across the region, the local child population far outpaces the supply of center-based child care, with only enough slots for approximately half of children under age 5 whose parents are in the workforce.
Existing full-day actual capacity among child care centers is largely full. Less than 14 percent of centers’ slots among their current full-day actual capacity are open and available to families seeking care. Further, many reported openings reflect expected short-term turnover between children. As a result, families across the region may frequently face substantial challenges securing child care that fits their needs and preferences. Limited child care supply can create severe challenges for the tens of thousands of local working families who depend on stable, full-day child care to remain in the workforce.
Within this constrained supply environment, families seeking infant care and families that rely on certificates to pay for care may face uniquely substantial barriers. Infant care supply is especially limited, with capacity to serve just 1 out of every 5 infants in the region. For families that are eligible for child care certificates, access is constrained by both state-level funding barriers and, for families that do successfully obtain a certificate, access to a certificate-supported slot is not guaranteed. Further, because barriers to access care can often overlap, families with infants who rely on certificates may face compounded challenges when trying to find child care in the region.
With the population of young children exceeding the supply of center-based child care, local child care centers are often able to fill their classrooms with little difficulty. However, child care supply shortages may leave families on long waitlists, piecing together different informal child care options, or unable to access care altogether.
Davidson County Child Care Landscape Study Resources
About the Davidson County Child Care Landscape Study
The United Way of Greater Nashville is engaging the Prenatal-to-3 Policy Impact Center at Vanderbilt University (Policy Impact Center) to conduct the Davidson County Child Care Landscape Study to examine child care supply, population metrics that inform demand, and the estimated cost of providing high-quality child care in Davidson County. The Davidson County Child Care Landscape Study consists of three phases.
- Phase 1 focuses on using state- and national-level publicly available data to understand the population and demographic characteristics of Davidson County that inform local child care demand and current supply. Though these data provided a foundational overview of the local child care landscape, they also revealed limitations in what could be understood without targeted data collection to provide more detailed, local data. A summary of key findings was released in March 2024.d
- Phase 2 consists of an in-depth child care supply analysis based on an original child care provider survey. The Policy Impact Center developed and fielded the 2025 Davidson County Child Care Provider Experience Survey (Child Care Provider Survey) between June and August 2025 to all licensed child care programs in the greater Davidson County area. A total of 130 (116 center-based and 14 home-based) out of 275 (246 center-based and 29 home-based) reachable child care programs participated in the Child Care Provider Survey (47% response rate) and provided sufficient information to be included in our analyses. We present findings from this phase throughout this five-part brief series. The Child Care Provider Survey asked about:
- Child care enrollment and open slots,
- Staffing, workforce characteristics, and educator wages,
- Child care program director experiences and challenges.
- Phase 3 uses a cost estimation model informed by Tennessee- and Davidson County-specific data and input from local child care experts and community partners to estimate the cost of providing high-quality child care in Davidson County. We discuss findings from this phase pertaining to center-based child care and home-based child care in Briefs 4 and 5, respectively, of this five-part series.
Results from the Nashville Child Care Landscape Study will inform child care expansion planning, resource allocation decisions, and policy and funding advocacy.
A complete description of the methods used in this brief can be found in the online Methods Appendix.
Who We Are
Prenatal-to-3 Policy Impact Center
The Prenatal-to-3 Policy Impact Center translates the science of the developing child into state-level policies that have the strongest evidence of improving outcomes for infants, toddlers and their parents. Based in Vanderbilt University’s Peabody College of Education and Human Development, the Center’s team of researchers and nonpartisan policy experts work with policymakers, practitioners, and advocates to navigate the evidence on solutions for effective child development in the earliest years. Learn more at www.pn3policy.org.
United Way of Greater Nashville
At United Way, we unite the community and mobilize resources so that every child, individual and family thrives. Together, we are working to create a community where every child receives a quality education, no one lives in poverty or poor health, and the most basic needs of our families are met. Serving the community for more than 100 years, United Way of Greater Nashville is also recognized as the founding chapter of the Alexis de Tocqueville Society, a now global giving society that has invested more than $10 billion in the work of United Ways worldwide. United Way of Greater Nashville is creating lasting change throughout Middle Tennessee. We are uniquely positioned to do this work by bringing individuals, businesses, nonprofits and government to the table to have the tough conversations, mobilize the resources and make the smart investments that will create lasting solutions for our region’s most pressing issues. Our service area includes Cheatham, Davidson, Dickson, Hickman, Houston, Montgomery, Robertson, Stewart and Williamson counties. Learn more at www.unitedwaygreaternashville.org.
Raising Readers Nashville
Raising Readers Nashville is a collaborative working to support systems change in the area of early childhood education. We serve the early childhood community by working to improve literacy in four domains of focus: Ready to Read, Literacy Skill Development, Family and Caregiver Engagement and Educator Support. We do this in four ways, incubator, a leader of active initiatives, convenor or accelerator where we partner with community and as champion to amplify the work of others. Learn more at www.raisingreadersnashville.org.
References
1 First Five Years Fund. (2024, March 6). Fact sheet: Child care and the economy. https://www.ffyf.org/2024/03/06/fact-sheet-child-care-and-the-economy/
2 Osborne, C., Kresse, A., Skatter, N., Xu, N., Huffman, J., & Craig, S. (2024, July 15). Early investment, a lifetime of returns: Articulating the value of early childhood investments in Virginia. Prenatal-to-3 Policy Impact Center. https://pn3policy.org/early-investment-a-lifetime-of-returns-articulating-the-value-of-early-childhood-investments-in-virginia/
3 Administration for Children and Families (ACF). (2024, October 24). Understanding families’ needs and preferences to Advance Measurement of Equitable Access to Child Care and Early Education. U.S. Department of Health and Human Services. https://acf.gov/sites/default/files/documents/opre/opre-understanding-families-needs-preferences-oct24.pdf
4 Tennessee Department of Human Services. (2025). Find child care. https://www.tn.gov/humanservices/for-families/child-care-services/find-child-care.html
5 US Census Bureau. (2023). QuickFacts: Davidson County, Tennessee. https://www.census.gov/quickfacts/fact/table/davidsoncountytennessee/SBO060222
6 US Census Bureau. (2023). Population under 18 years by age: 2023 ACS 5-Year Estimates Detailed Tables (B09001)
[Data set]. https://data.census.gov/
7 US Census Bureau. (2023). Hispanic or Latino origin by race: 2023 ACS 5-Year Estimates Detailed Tables (B03002)
[Data set]. https://data.census.gov/
8 US Census Bureau. (2023). Poverty status in the past 12 months: 2023 ACS 5-Year Estimates Detailed Tables (S1701)
[Data set]. https://data.census.gov/
9 US Census Bureau. (2023). Age of own children under 18 years in families and subfamilies by living arrangements by employment status of parent: 2023 ACS 5-year Estimates Detailed Table (B23008) [Data Set]. https://data.census.gov/
10 Tennessee Department of Human Services. (2025). Licensure rules for child care agencies (Chapter 1240-04-01).
Tennessee Secretary of State. https://publications.tnsosfiles.com/rules/1240/1240-04/1240-04-01.20251120.pdf
11 Osborne, C., Rowe, S., Doe, H., Whipps, M.D.M., Kresse, A., & Huffman, J. (2024). Davidson County child care landscape study. Prenatal-to-3 Policy Impact Center. https://pn3policy.org
12 Miller-Bains, K, Yu, S.,, & Bassok D. (2024). Is authorized capacity a good measure of child care providers’ current capacity? New evidence from Virginia. EdWorkingPaper: 24-983. Annenberg Institute at Brown University. https://doi.org/10.26300/w0mj-nk43
13 Miller-Bains, K., Yu, S., & Bassok, D. (2025). Is authorized capacity a good measure of child care providers’ current capacity? New evidence from Virginia. Early Childhood Research Quarterly, 71, 92-103. https://files.eric.ed.gov/fulltext/ED672494.pdf
14 Osborne, C., Rowe, S., Doe, H., Whipps, M.D.M., Kresse, A., & Huffman, J. (2024). Davidson County child care landscape study. Prenatal-to-3 Policy Impact Center. https://pn3policy.org
15 Osborne, C., Rowe, S., Doe, H., Whipps, M.D.M., Kresse, A., & Huffman, J. (2024). Davidson County child care landscape study. Prenatal-to-3 Policy Impact Center. https://pn3policy.org
16 Bipartisan Policy Center. (2026). The child care and development fund: How recent administrativeactions may impact states, families, and the workforce. https://bipartisanpolicy.org/explainer/the-child-care-and-development-fund-how-recent-administrative-actions-may-impact-states-families-and-the-workforce/
17 Child Care Aware of America. (2019). 2019 State fact sheets. https://info.childcareaware.org/2019-state-fact-sheets-download
18 Centers for Disease Control and Prevention, National Center for Health Statistics. (2024). National Vital Statistics System: Natality (2016–2024). [Data set]. CDC WONDER Online Database. http://wonder.cdc.gov/natality-expanded-current.html
19 Prenatal-to-3 Policy Impact Center (2026). The people behind early care and education: Understanding the early childhood workforce in greater Davidson County, TN https://pn3policy.org.
20Workman, S., & Jessen-Howard, S. (Nov. 15, 2018). Understanding the true cost of child care for infants and toddlers.
Center for American Progress.https://www.americanprogress.org/issues/earlychildhood/reports/2018/11/15/460970/understanding-true-cost-child-care-infants-toddlers
21 Prenatal-to-3 Policy Impact Center. (2021). Paid family leave and affordable child care are integral to a strong Prenatal-to-3 system of care (B.004.0221). Child and Family Research Partnership. Lyndon B. Johnson School of Public Affairs, University of Texas at Austin. https://pn3policy.org/resources/paid-family-leave-and-affordable-child-care-are-integral-to-a-strong-prenatal-to-3-system-of-care
22 Prenatal-to-3 Policy Impact Center. (2025). Child care subsidies. https://pn3policy.org/pn-3-state-policy-roadmap-2025/us/child-care-subsidies/
23 Tennessee Department of Human Services. (n.d.). Child care certificate program. Retrieved January 2026, from https://www.tn.gov/humanservices/for-families/child-care-services/child-care-payment-assistance/child-care-certificate-program.html
24 Tennessee Department of Human Services. (2025). Find child care. https://www.tn.gov/humanservices/for-families/child-care-services/find-child-care.html
25 Tennessee Department of Human Services. (2022). Income eligibility limits and parent co-pay fee table – Fiscal year 2022-2023.[PDF]. https://www.tn.gov/content/dam/tn/human-services/documents/Income%20Eligibility%20and%20Parent%20Co-Pay%20Fee%20Table%202022-2023.pdf
26 Tennessee Department of Human Services. (2025). Update on child care funding. Retrieved January 2026, from https://www.tn.gov/humanservices/for-families/child-care-services/update-on-child-care-funding.html
Authors
Brief Prepared by:
Cynthia Osborne, PhD; Sierra Rowe, MPAff; and Monica G. Navarro
Acknowledgements:
Kaeley Benson, PhD; Kels Bowman, PhD, Jennifer Huffman, MPAff; and Sarah Brown
Recommended Citation:
Prenatal-to-3 Policy Impact Center (2026). Early Education for the Next Generation: Understanding Child Care Supply in Greater Davidson County, TN. https://pn3policy.org.


