
Introduction
Download the full brief to explore what it actually costs to provide high-quality center-based child care in greater Davidson County and what that gap between market price and true cost means for educators, programs, and families.
High-quality child care is an essential resource for families and children. Reliable child care enables parental workforce participation, simultaneously providing children with a safe, nurturing, and structured environment that promotes healthy development.1 Quality child care also strengthens families’ economic stability, improving child developmental outcomes and promoting broader economic growth.2
Despite the essential need for child care, families face challenges accessing and affording it, and child care program directors face challenges recruiting and retaining educators and maintaining financially sustainable businesses.3, 4
This brief examines the cost of providing high-quality center-based child care for children under age 5 in the greater Davidson County, Tennessee region using a cost estimation model framework. A cost estimation model considers the actual cost of providing high-quality care with a well-compensated workforce, rather than relying on the prices that parents can afford.
This brief is one part of a five-part series presenting the findings from the Davidson County Child Care Landscape Study conducted by the Prenatal-to-3 Policy Impact Center (Policy Impact Center) at Vanderbilt University. Below, we detail the true cost of providing center-based child care, and Brief 5, the next brief, covers home-based child care.
Background
Every day, as families seeking child care across greater Davidson County navigate difficult trade-offs between affordability and quality, child care programs also work to offer enriching and safe environments on limited budgets. A strong child care system supports both families and programs by enabling families to access affordable, high-quality child care and ensuring providers can sustain financially viable programs with a stable, well-supported, and adequately compensated workforce. Reaching this balance requires a clear understanding of what providing high-quality child care actually costs programs.
The Market Price of Child Care Depends on Underpaying Educators
Understanding the cost of child care begins with the state’s market rate survey, conducted annually in Tennessee, which measures the amount (price) child care programs charge families across the state.5 However, market rates reflect the prices that families are willing or able to pay, not what it actually costs programs to sustainably deliver high-quality child care. Therefore, market rates provide an incomplete picture of the actual cost of services.
A key component of high-quality child care is a stable, well-supported, and adequately compensated workforce. When educators stay in their roles, children benefit from stronger educator-child relationships, better classroom quality, and educators who can build expertise over time.6,7 Yet current market prices leave limited room for programs to compensate educators at a level that supports long-term workforce stability.
At an average child care center in greater Davidson County, 9 in 10 educators earn less than the local ALICE Household Survival Budget Threshold ($22.50 per hour). More than 2 out of 5 child care centers do not offer health insurance (42%) or retirement plans (44%).a Further, 57 percent of child care centers experience high annual educator turnover (greater than 20% annually).b,8
Child care programs report limited ability to address these challenges. Almost half of center-based programs describe themselves as either breaking even or operating at a loss, indicating that raising educator wages or improving benefits could push some programs out of business.9 Programs also have limited ability to raise tuition to increase revenue, as many families already struggle to afford child care.

As a result, programs cannot set tuition rates to reflect the true cost of providing high-quality child care, which would include paying educators a living wage, without making child care services cost-prohibitive to most families.10 Further, market prices (i.e., tuition prices) from the annual market rate survey are used to set the reimbursement rates for child care certificates (i.e., subsidies), reinforcing the gap between the resources providers have and the true cost of high-quality child care.
Cost Estimation Models Calculate the True Cost of High-Quality Child Care
A high-quality child care cost estimation model (cost estimation model) is an alternative cost estimation framework that overcomes the limitations of market rate surveys. Rather than relying on the constrained amount that families can pay, this model estimates costs from the providers’ perspective.
Cost estimation models account for all expenses involved in delivering high-quality child care, including educator wages that reflect a living wage and fair benefits, facility expenses, and learning materials, to generate a comprehensive estimate of the total cost to sustain a high-quality child care program with a stable workforce.11
To estimate the cost of providing high-quality child care in the region, the Policy Impact Center developed a child care cost estimation model for greater Davidson County. The Policy Impact Center convened with local child care community partners and experts (Child Care Workgroup) to tailor the cost estimation model to the local realities of greater Davidson County.
The cost estimation model captures the full range of day-to-day resources needed to operate safe, responsive, and enriching child care programs in the region. The cost estimation model relies on local, state, and national cost data, including data from the Davidson County Child Care Provider Experience Survey (Child Care Provider Survey), an original survey developed and fielded by the Policy Impact Center in Summer 2025 (N=275, including 246 centers and 29 homes; 47% response rate).c
The cost estimation model estimates costs, including educator wages, specific to the cost of living in the greater Davidson County area, which has a relatively high cost of living compared to other areas in the state. Therefore, cost estimation models designed for most other areas in Tennessee would likely generate lower cost estimates for the true cost of high-quality child care.
c The Policy Impact Center cost estimation model is built on the framework developed by other models, such as Prenatal to Five Fiscal Strategies, and informed by the Administration for Children & Families’ Office of Child Care, as detailed in our online Methods Appendix.
The Monthly True Cost of High-Quality Center-Based Care Ranges from $2,214 for Preschoolers to $3,457 for Infants
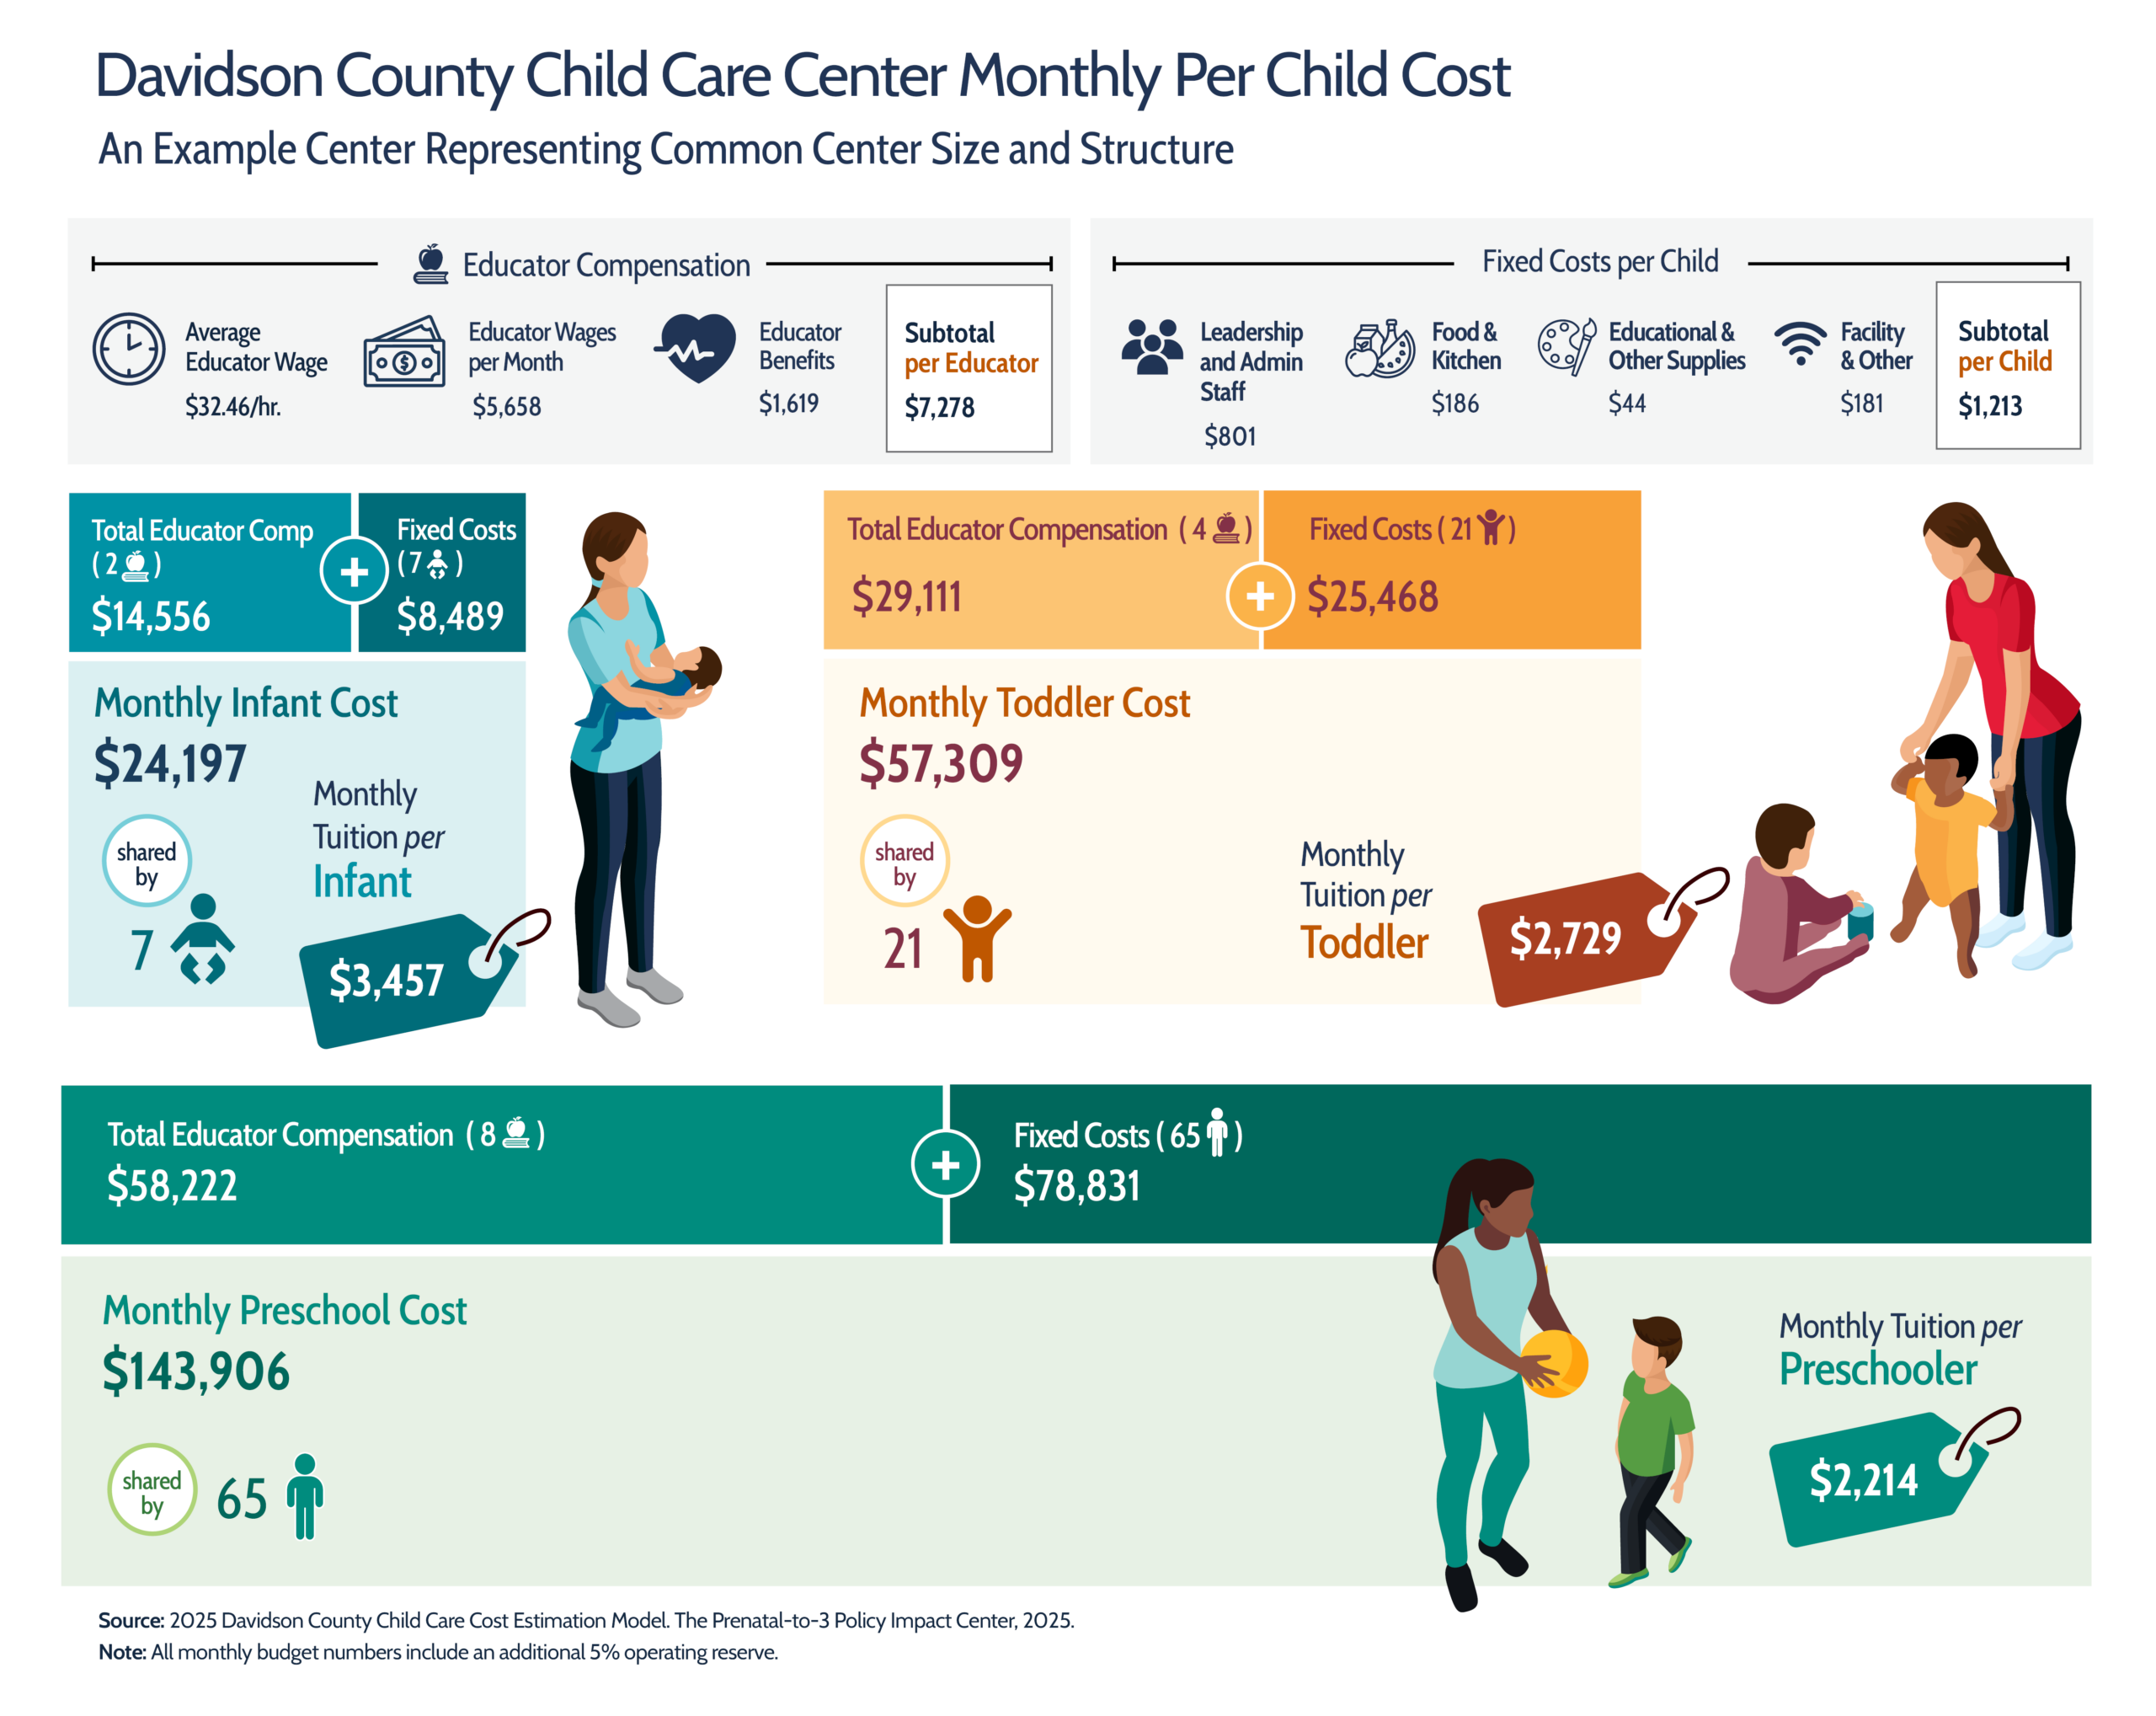
The estimated monthly cost of high-quality center-based child care is $3,457 for infants, $2,729 for toddlers, and $2,214 for preschoolers in greater Davidson County. This estimate is created using a model child care center representing the typical size and structure of local programs. As shown in Table 1, costs vary widely across age groups because staffing expenses vary across age groups.
Table 1: Estimated Monthly Cost Per Child of Providing High-Quality Center-Based Care in Greater Davidson County
High-Quality Infant Care Is the Most Expensive Because Low Educator-to-Child Ratios and Smaller Maximum Group Sizes Require More Educators Per Infant
Educator-to-child ratios vary widely across child age groups. For example, in Tennessee, ratios and group size limits allow two educators to serve up to eight infants in one class, compared to a preschool class in which two educators can serve 20 preschoolers.12
Whereas other operating costs (e.g., food or insurance) can be evenly divided across all children at a center, staffing costs vary considerably by classroom. Because educator wages and benefits make up the biggest portion of child care program expenditures, classrooms with fewer children have higher staffing costs per child. As a result, infant care, with relatively lower ratio and group size limits, is far more expensive to provide compared to care for older age groups.
Figure 1 illustrates the variation in cost across age groups, as well as the expenses incurred by a center to provide high-quality care, including a living wage for all staff that is commensurate with their education and experience.
The High Cost of Infant Care Leads Programs to Offer Fewer Infant Classes in Favor of Preschool Classes
Because of the smaller class sizes and lower educator-to-child ratios, infant care is the most difficult age of care for child care programs to offer in a financially sustainable way.13,14 In greater Davidson County, only an estimated 10 percent of available child care slots are offered to infants. The region can provide infant care to only approximately 1 in 5 infants born in greater Davidson County in 2024.d
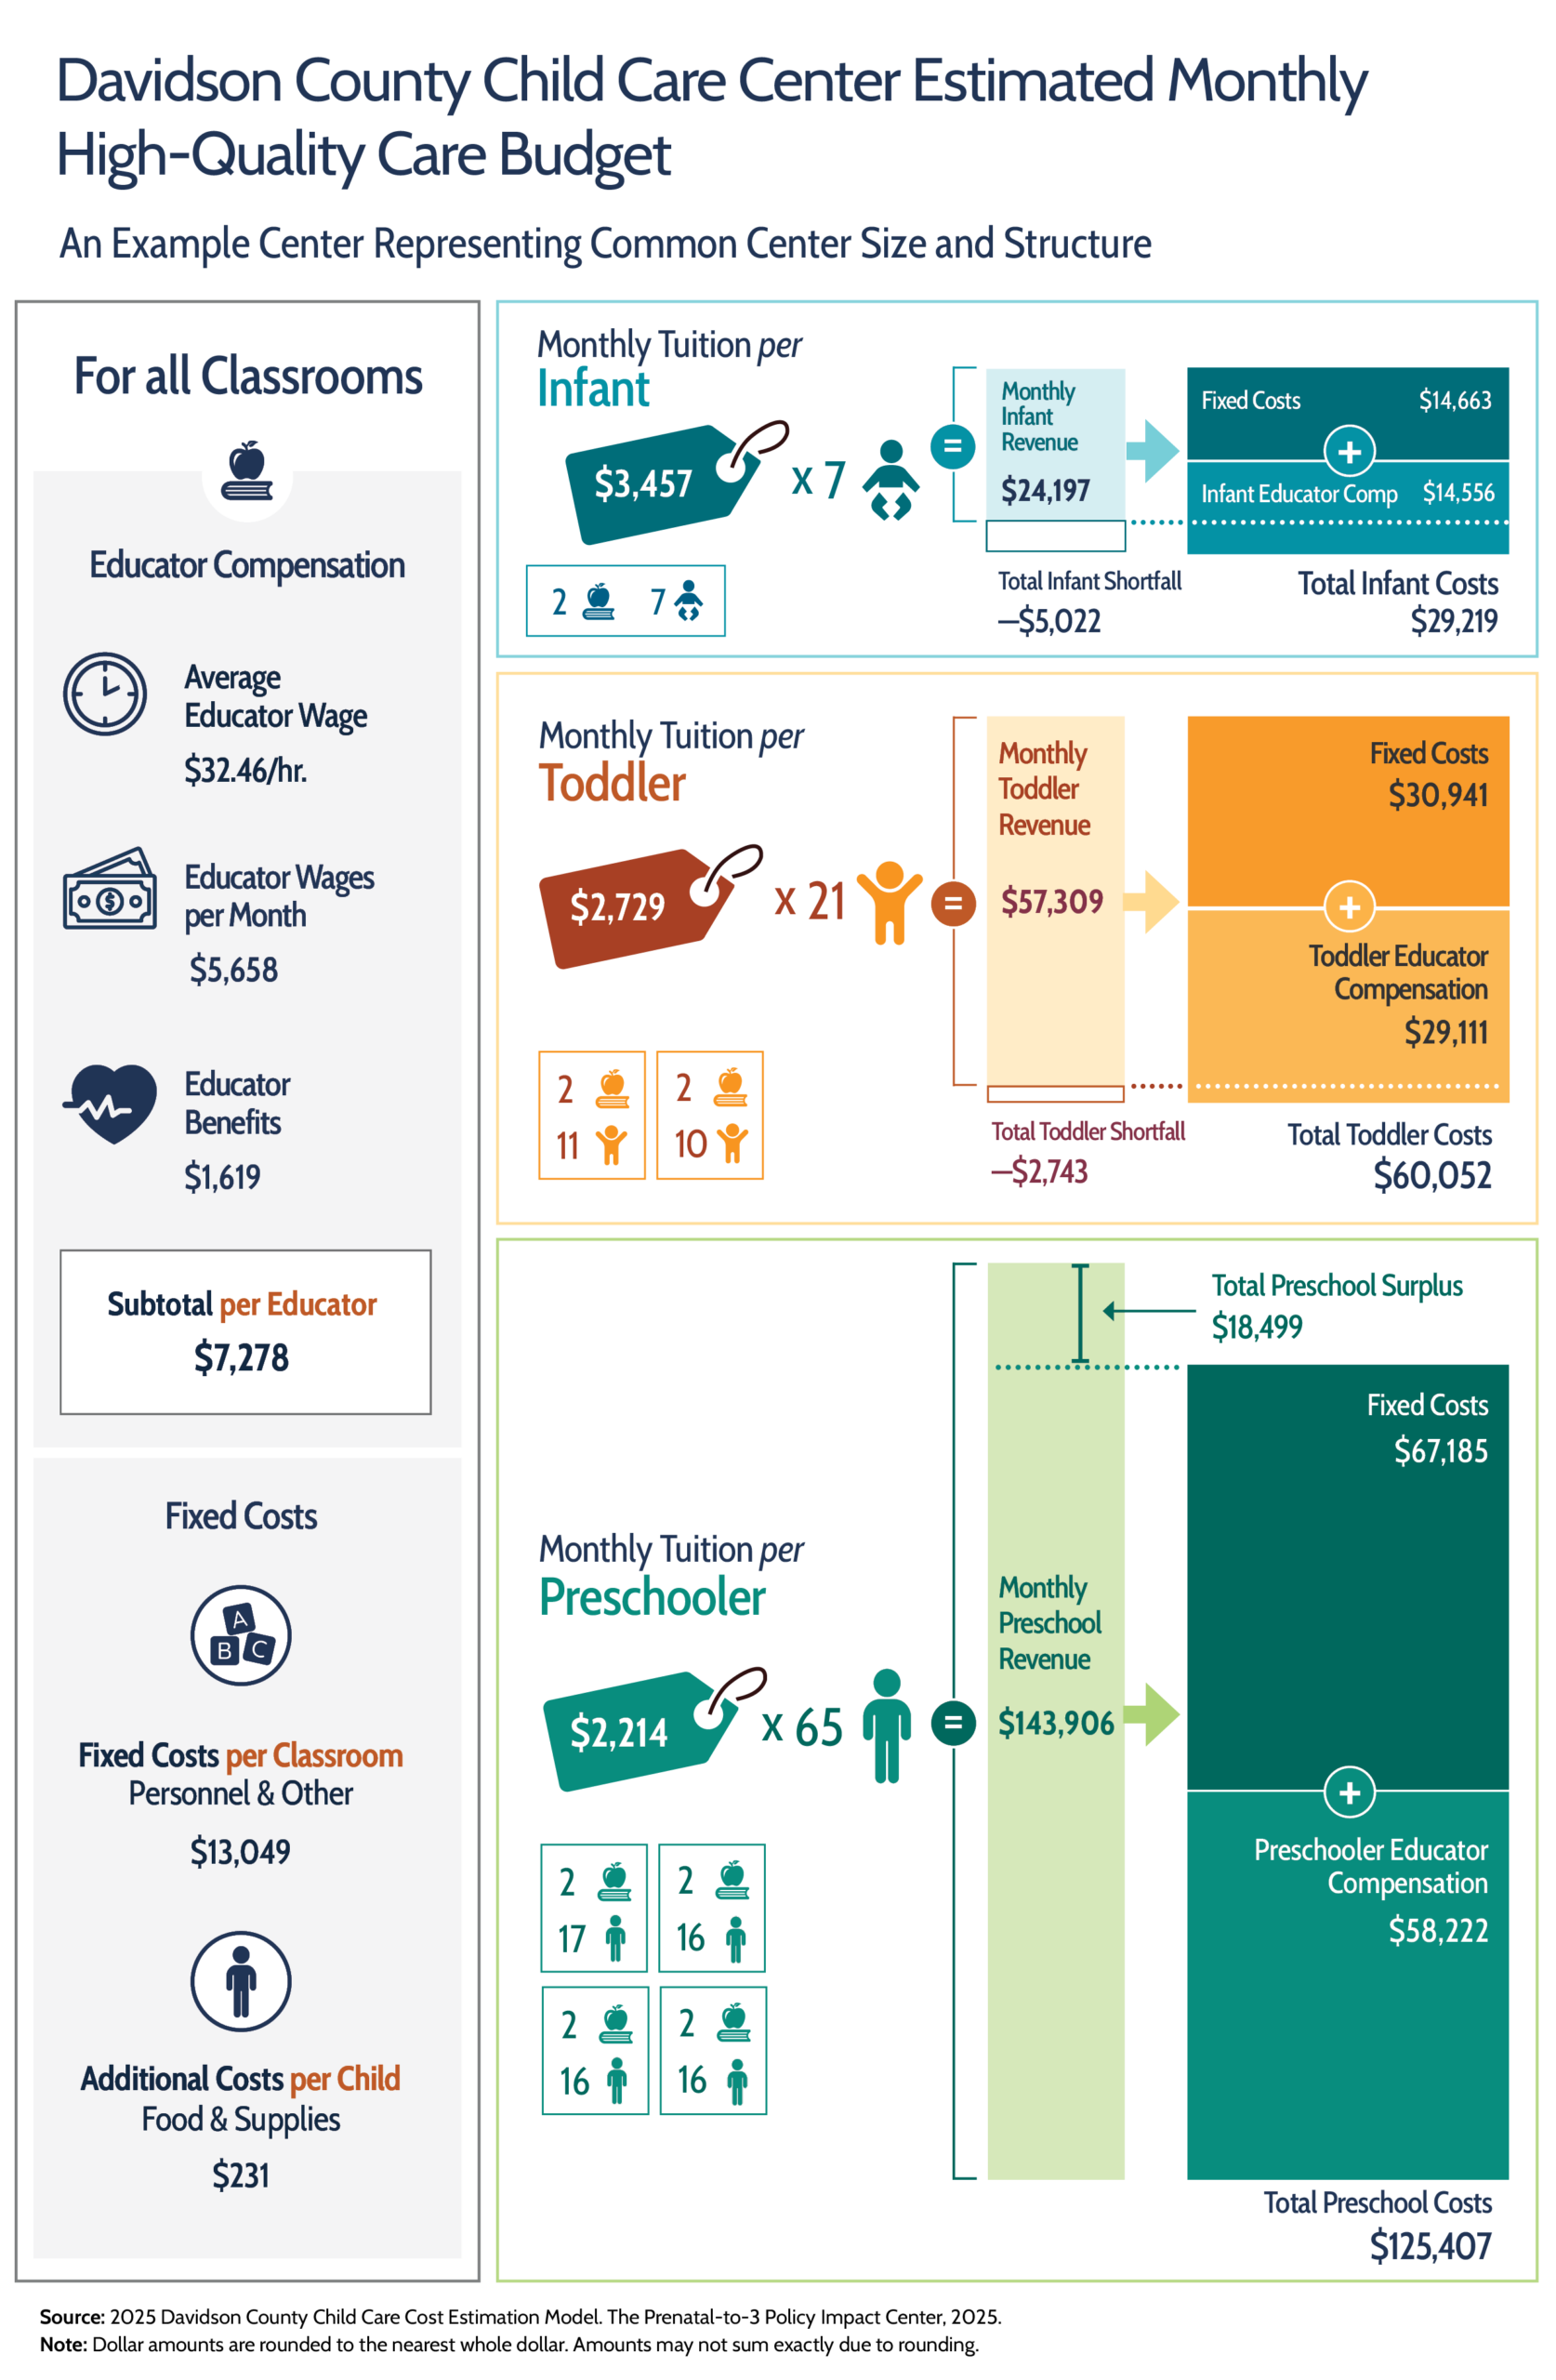
Figure 2 illustrates how differences in class-size limits and educator-to-child ratios across age groups affect the finances of a typical child care center. The figure compares the monthly revenue and expenses associated with classrooms serving infants, toddlers, and preschoolers. Because fixed costs are distributed evenly across all classrooms and children in a program, whether a classroom generates a shortfall or surplus largely reflects the number of children it can serve (and the tuition revenue it can generate) relative to staffing requirements of that classroom based on the age it serves.
Examining classroom-level revenue and expenses in Figure 2 reveals that infant and toddler classrooms operate at a financial loss. Tuition revenue does not fully cover the cost of staffing and operating infant classrooms. In contrast, preschool classrooms generate excess revenue after covering their own costs, helping offset the financial losses associated with serving the youngest children.
In practice, these cost dynamics lead programs to operate more preschool classrooms than infant classrooms. Expanding preschool capacity improves financial stability, whereas adding an infant classroom may actually make a program worse off financially. As a result, many programs limit the number of infant classrooms they offer or choose not to serve infants at all, contributing to the limited availability of infant care for families across greater Davidson County.
Tuition Priced at the Estimated True Cost of Care Makes Child Care Unattainable for Families
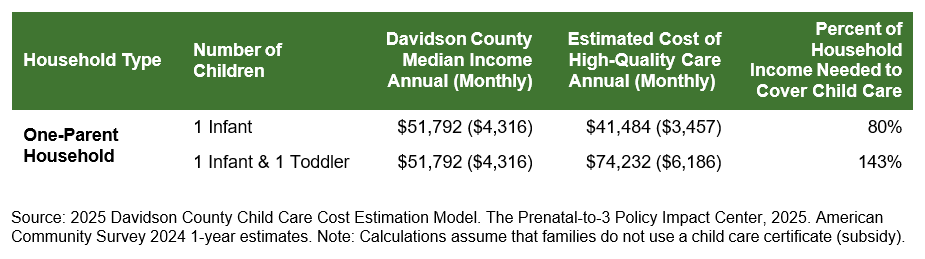
A Single Parent with Two Children Earning the County Median Income ($51,792) Would Face Costs Equivalent to 143% of Their Annual Income at the True Cost of High-Quality Care
If child care centers charged tuition that reflected the estimated true cost of high-quality care, the resulting prices would be unattainable for most families. In greater Davidson County, high-quality child care for one infant and one toddler, priced at the estimated true cost of care, would represent roughly 143 percent of the median household income for a one-parent household (see Table 2).
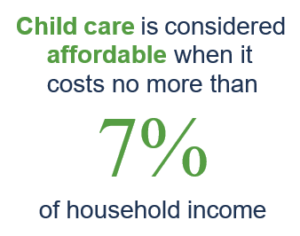
The Federal government has previously defined affordable child care as costing no more than 7 percent of household income.15 By this standard, child care in greater Davidson County is considered affordable only if total costs are capped at approximately $302 per month for a median-income single-parent household. This considerable gap between the estimated true cost of high-quality care and what is affordable for families underscores why child care centers cannot set tuition equal to the estimated cost of high-quality care as a strategy for increasing educator pay to ensure a living wage and benefits.
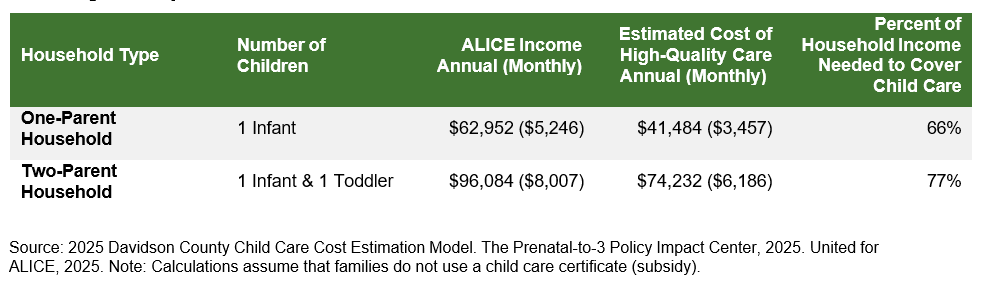
High-Quality Child Care at the Estimated True Cost Would Cost 77% of the Annual Income for a Two-Parent, Two-Child Family Living at the ALICE Threshold
For a household living at the ALICE Household Survival Budget Threshold, which is higher than the median individual income in the region, child care priced at the estimated true cost of high-quality care would cost two-thirds or more of annual household income. For a one-parent household with a single infant, covering child care alone would require 66 percent of annual income (see Table 3). For a two-parent household with an infant and a toddler, covering child care would cost 77 percent of annual income. Without financial assistance, such as a child care certificate (i.e., subsidy), high-quality child care would be completely out of reach for families in greater Davidson County with incomes near the ALICE Threshold.
Table 3: Percent of Household Income at the ALICE Household Survival Budget Threshold Required to Cover High-Quality Child Care Costs
Current Market Prices and Certificate Reimbursement Rates Do Not Cover the Estimated True Cost of Care
Child care centers do not receive revenue commensurate with the true cost of care, either through certificates, which account for approximately 15 percent of all occupied full-time slots in the region, or through the remaining 85 percent of slots filled by families that do not use subsidies. Families without subsidies generally pay market price for child care, though many child care programs offer tuition on a sliding scale, with lower fees for families with lower incomes, to make child care as accessible as possible.
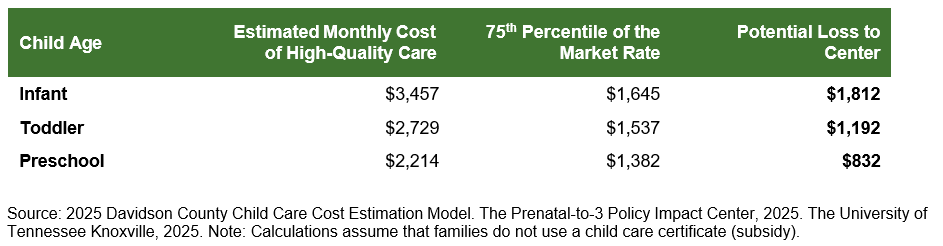
The market price reflects what families are able to pay for full-time child care today. The 75th percentile of the market rate means that 75 percent of providers charge that amount or less for care, and the remaining 25 percent of providers charge higher prices. The 75th percentile is what the US government considers the “equal access target.”16 Market rates vary by child age, given that younger children are more costly to serve than older children.
Using infants as an example, in Nashville, a center charging tuition at the 75th percentile of the market rate ($1,645) would fall substantially below the estimated true cost of care ($3,457), resulting in a potential loss of $1,812 per month per child at that center (see Table 4). Because 75 percent of centers in the region charge less than $1,645 for infant care, many programs face even larger per-infant losses, underscoring how market tuition rates, constrained by what families are able to pay, remain far below the true cost of providing high-quality care.
Table 4: Comparison of Monthly Per Child High-Quality Center-Based Care True Costs and Market Prices
Families that earn low or moderate incomes and meet specific work or education requirements may qualify for the Child Care Certificate Program, which provides financial assistance, or subsidized child care, to help make care more affordable.17,18 Child care certificates are limited, however, leading to only a small proportion of eligible families actually receiving a certificate to assist in paying for child care.
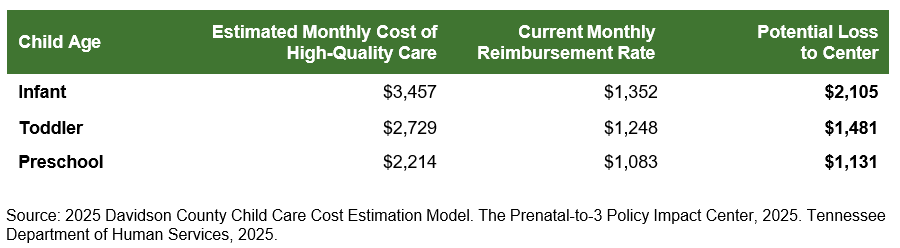
When families use certificates for child care, child care programs are reimbursed, with the maximum reimbursement rate set by the state of Tennessee. Most of the reimbursement is paid to providers by the state, and in some instances, families pay a portion of the reimbursement rate in the form of a copay. As with most states, Tennessee uses the state’s market rate survey to inform and set certificate reimbursement rates.e,19 Tennessee has the goal of providing reimbursement rates that meet at least the 60th percentile of the market rate, meaning the state does not meet the federal target (the 75th percentile). Fifteen states currently meet the 75th percentile target.20
Because market-rate tuition prices are less than the true cost of providing high-quality child care, current child care certificate reimbursement rates for high-quality centers in greater Davidson County underpay centers by as much as $2,105 per child per month (see Table 5). For infants and toddlers, state reimbursement rates are less than half of the estimated true cost of care.
Table 5: Comparison of Monthly Per Child High-Quality Center-Based Care Costs and Certificate Reimbursement Rates
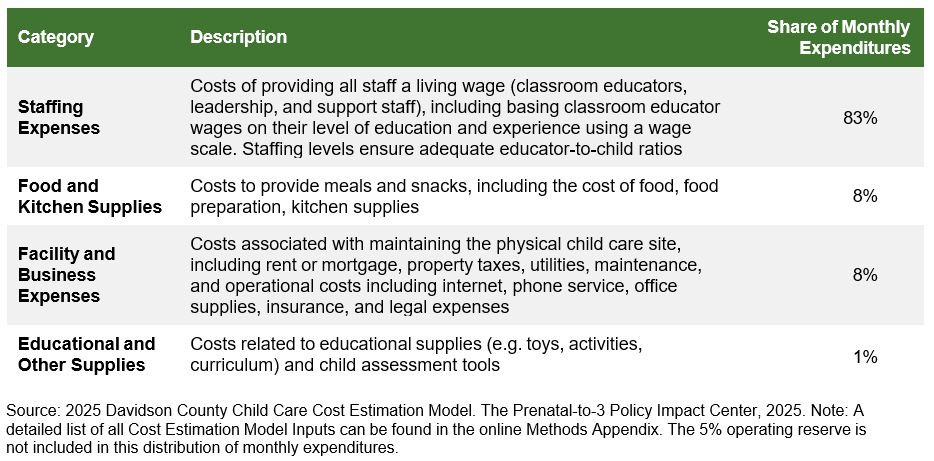
Neither the market rate nor certificate reimbursement rates come close to covering the estimated true cost of high-quality care. Costs such as the facility, food, supplies, and insurance are all fixed costs, with little room to reduce expenses. This leaves staffing costs, which also make up the vast majority (83%) of the center’s budget, as the only costs that can be changed to reduce tuition to a price parents can afford, reinforcing a system of low wages for educators.
The Cost Modeling Process
The following section provides insight into the process of creating the high-quality child care cost estimation model. Throughout the process, we worked with the Child Care Workgroup to ensure decisions reflect the local realities of the greater Davidson County child care system and used the most local data available for each cost.
Step 1: Create an “Example Center”
To model costs, we created an “example center” that represents the typical size of a center operating in greater Davidson County, with classrooms assigned to different age groups similar to how centers in the region use their space. Center size and classroom usage are based on data from the Child Care Provider Survey collected by the Policy Impact Center.
The example center has seven classrooms: one infant room with seven infants; two toddler rooms with 10-11 toddlers per room; and four preschool rooms with 16-17 preschoolers per room. The center serves a total of 93 children.
To model staffing at the example center, the Policy Impact Center relied on the Child Care Workgroup to identify the leadership, administrative, and classroom staff needed to provide high-quality care. The following full-time staff positions are included for the cost estimation model example center at the recommendation of the Child Care Workgroup:
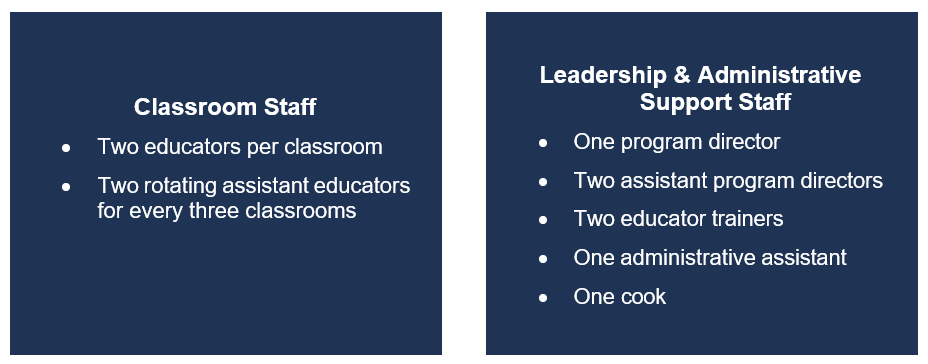
The model includes educator-to-child ratios and maximum group sizes in line with the Tennessee Department of Human Services (TDHS) child care regulations, based on the Child Care Workgroup’s recommendations.
Step 2: Identify Costs
We then identified each of the costs associated with providing high-quality center-based child care, and assigned a cost value based on the example center’s size and children served. Costs associated with providing high-quality child care include staffing expenses; costs associated with owning or renting and maintaining a facility; business operation expenses; and food and snacks for the children. Table 6 outlines the major expenditure categories.
Staffing expenses account for most of a child care center’s monthly costs. To identify staffing expenses for the cost estimation model, we first determined the wages staff will earn, then estimated the total staffing cost for the example center by adding all educator, leadership, and support staff wages.
The Child Care Workgroup prioritized ensuring adequate wages and benefits for full-time educators, administrative staff, and support staff. Supporting staff fairly is critical to reducing workforce instability, retaining skilled educators, and ensuring high-quality care. Guided by this input, three key considerations informed the cost estimation model’s wage and benefit assumptions:
- The model incorporates a wage scale for educators that increases pay based on educational attainment and years of experience, to reflect the value of professional growth and retention.
- The wage scale ensures a living wage for a single adult with no children, as defined by the ALICE Household Survival Budget for Davidson County.21
- The model provides access to workplace benefits such as health insurance and retirement benefits.
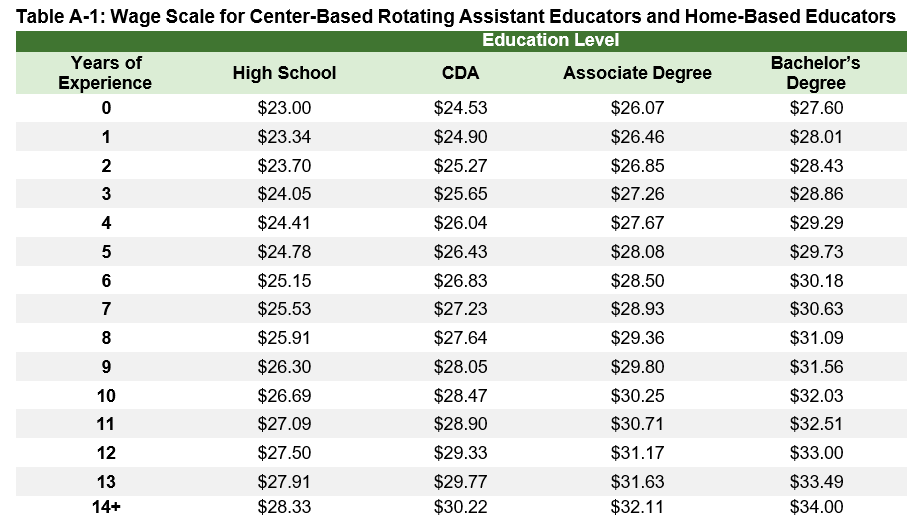
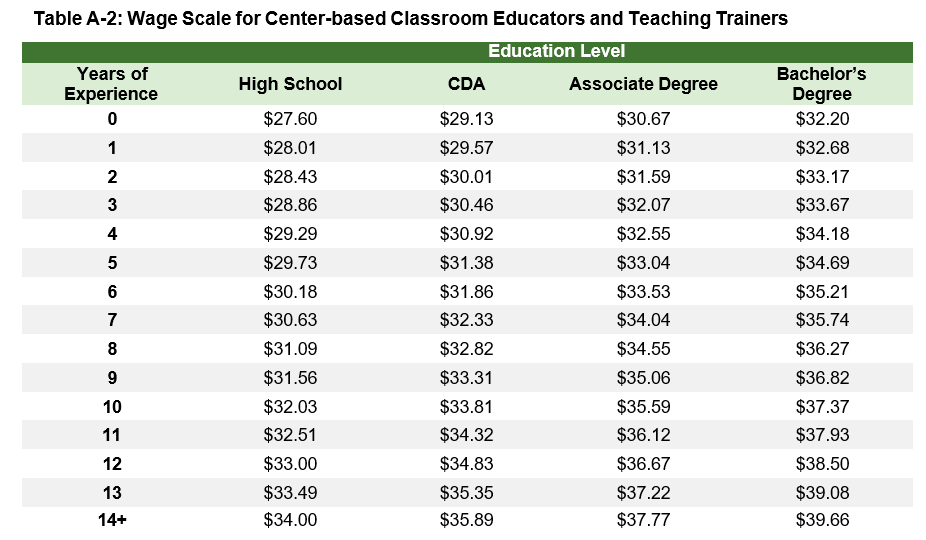
In other words, in the cost estimation model, each classroom educator receives a wage that recognizes their level of responsibility (i.e., lead or rotating assistant), education level, and experience. Using a wage scale ensures fair wages across educators and provides a pathway for career advancement to promote educator growth and retention. The wage scale starts at $23.00 per hour (i.e., above the ALICE Household Survival Budget Threshold) for rotating assistants with the minimum level of education and no experience. Lead teachers have a starting wage of $27.60 per hour to recognize the additional responsibilities of their role.
Each additional degree or level of educational attainment increases an educator’s wage, and each year of experience increases an educator’s wage (see Appendix A). First-year lead educators with a bachelor’s degree would earn $32.20 using this wage scale. By comparison, certified pre-K teachers with a bachelor’s degree employed by Metro Nashville Public Schools earn $35.57 per hour under the district’s 2025 salary schedule.f,22 Leadership and support staff were also assigned wages according to the level of responsibility and expectations of their role.
Next, we estimated total staffing costs at the example center. We use data on the education and experience levels of educators in greater Davidson County, as reported on the Child Care Provider Survey, to estimate wages for educators at the example center. Greater Davidson County has many educators with more than the minimum required education and experience levels; therefore, on average, educators would earn $32.64 per hour. For example, an estimated 36 percent of the workforce have a bachelor’s degree or higher, and 66 percent have at least 3 years of experience.g,23 Figure 3 compares the average wage used in the cost estimation model to the current average local wage and the ALICE Threshold.
For the remaining cost categories (food-related expenses, facility and business expenses, and educational and other supplies), the cost model incorporates local, state, or national cost estimates, depending on available data. The Child Care Workgroup reviewed the cost inputs to ensure the costs reflect greater Davidson County realities.
Conclusion
Child care market prices (i.e., tuition rates) are constrained by what families can afford to pay for child care, and tuition rates therefore cannot reflect the true cost of providing high-quality child care without pricing families out of the market. The Policy Impact Center and United Way of Greater Nashville partnered with the Child Care Workgroup, a local group of community partners and child care experts, to create a cost estimation model that estimates the true cost of high-quality child care in greater Davidson County.
The cost estimation model reveals the estimated true cost of high-quality center-based child care in greater Davidson County is $3,457 per month for infants, $2,726 per month for toddlers, and $2,214 per month for preschoolers.
Both market prices and child care certificate reimbursement rates fail to cover the true cost of high-quality child care. At the 75th percentile of market prices – meaning that 75 percent of programs charge less in tuition – center-based tuition rates leave a gap of as much as $1,812 per child per month between the tuition rate and the true cost of care. Tennessee’s child care certificate reimbursement rates leave a gap of up to $2,105 per child per month.
The gap left by current reimbursement rates, combined with families’ limited ability to absorb significantly higher tuition rates, drives programs to continue paying educators below a living wage, and leaves many educators without benefits such as health insurance and retirement contributions. This gap also leads to small numbers of infant slots, which are the least financially sustainable. As a result, child care programs often struggle to remain financially solvent as they simultaneously work to meet the needs of families, educators, and young children in the greater Davidson County region.
Davidson County Child Care Landscape Study Resources
Appendix A: Cost Estimation Model Educator Wage Scales
The cost estimation model implements wage scales based on an educator’s highest degree of education and years of experience, by role, as shown in Table A-1 and Table A-2. These wages are based on the cost of living in greater Davidson County.
About the Davidson County Child Care Landscape Study
The United Way of Greater Nashville is engaging the Prenatal-to-3 Policy Impact Center at Vanderbilt University (Policy Impact Center) to conduct the Davidson County Child Care Landscape Study to examine child care supply, population metrics that inform demand, and the estimated cost of providing high-quality child care in Davidson County. The Davidson County Child Care Landscape Study consists of three phases.
- Phase 1 focuses on using state- and national-level publicly available data to understand the population and demographic characteristics of Davidson County that inform local child care demand and current supply. Though these data provided a foundational overview of the local child care landscape, they also revealed limitations in what could be understood without targeted data collection to provide more detailed, local data. A summary of key findings was released in March 2024.d
- Phase 2 consists of an in-depth child care supply analysis based on an original child care provider survey. The Policy Impact Center developed and fielded the 2025 Davidson County Child Care Provider Experience Survey (Child Care Provider Survey) between June and August 2025 to all licensed child care programs in the greater Davidson County area. A total of 130 (116 center-based and 14 home-based) out of 275 (246 center-based and 29 home-based) reachable child care programs participated in the Child Care Provider Survey (47% response rate) and provided sufficient information to be included in our analyses. We present findings from this phase throughout this five-part brief series. The Child Care Provider Survey asked about:
- Child care enrollment and open slots,
- Staffing, workforce characteristics, and educator wages,
- Child care program director experiences and challenges.
- Phase 3 uses a cost estimation model informed by Tennessee- and Davidson County-specific data and input from local child care experts and community partners to estimate the cost of providing high-quality child care in Davidson County. We discuss findings from this phase pertaining to center-based child care and home-based child care in Briefs 4 and 5, respectively, of this five-part series.
Results from the Nashville Child Care Landscape Study will inform child care expansion planning, resource allocation decisions, and policy and funding advocacy. A complete description of the methods used in this brief can be found in the online Methods Appendix.
Who We Are
Prenatal-to-3 Policy Impact Center
The Prenatal-to-3 Policy Impact Center translates the science of the developing child into state-level policies that have the strongest evidence of improving outcomes for infants, toddlers and their parents. Based in Vanderbilt University’s Peabody College of Education and Human Development, the Center’s team of researchers and nonpartisan policy experts work with policymakers, practitioners, and advocates to navigate the evidence on solutions for effective child development in the earliest years. Learn more at www.pn3policy.org.
United Way of Greater Nashville
At United Way, we unite the community and mobilize resources so that every child, individual and family thrives. Together, we are working to create a community where every child receives a quality education, no one lives in poverty or poor health, and the most basic needs of our families are met. Serving the community for more than 100 years, United Way of Greater Nashville is also recognized as the founding chapter of the Alexis de Tocqueville Society, a now global giving society that has invested more than $10 billion in the work of United Ways worldwide. United Way of Greater Nashville is creating lasting change throughout Middle Tennessee. We are uniquely positioned to do this work by bringing individuals, businesses, nonprofits and government to the table to have the tough conversations, mobilize the resources and make the smart investments that will create lasting solutions for our region’s most pressing issues. Our service area includes Cheatham, Davidson, Dickson, Hickman, Houston, Montgomery, Robertson, Stewart and Williamson counties. Learn more at www.unitedwaygreaternashville.org.
Raising Readers Nashville
Raising Readers Nashville is a collaborative working to support systems change in the area of early childhood education. We serve the early childhood community by working to improve literacy in four domains of focus: Ready to Read, Literacy Skill Development, Family and Caregiver Engagement and Educator Support. We do this in four ways, incubator, a leader of active initiatives, convenor or accelerator where we partner with community and as champion to amplify the work of others. Learn more at www.raisingreadersnashville.org.
References
1 First Five Years Fund. (2024, March 6). Fact sheet: Child care and the economy. https://www.ffyf.org/2024/03/06/fact-sheet-child-care-and-the-economy/
2 Osborne, C., Kresse, A., Skatter, N., Xu, N., Huffman, J., & Craig, S. (2024, July 15). Early investment, a lifetime of returns: Articulating the value of early childhood investments in Virginia. Prenatal-to-3 Policy Impact Center. https://pn3policy.org/early-investment-a-lifetime-of-returnsarticulating-the-value-of-early-childhood-investments-in-virginia/
3 Administration for Children and Families (ACF). (2024, October 24). Understanding families’ needs and preferences to Advance Measurement of Equitable Access to Child Care and Early Education [PDF].
U.S. Department of Health and Human Services. https://acf.gov/sites/default/files/documents/opre/opre-understanding-families-needs-preferences-oct24.pdf
4 National Scientific Council on the Developing Child. (2012). The science of neglect: The persistent absence of responsive care disrupts the developing Brain: Working Paper No. 12. https://developingchild.harvard.edu/resources/working-paper/the-science-of-neglect-thepersistent-absence-of-responsive-care-disrupts-the-developing-brain/
5 Pratt, E. (2025, August). Determining child care market rates in the state of Tennessee: FY 25 market rate survey. Tennessee Department of Human Services. The University of Tennessee, Boyd Center for Business & Economic Research. Retrieved October 8, 2025, from https://www.tn.gov/content/dam/tn/human-services/documents/FY%2025%20Market%20Rate%20Survey.pdf
6 Adams, E., Brickhouse, T., Dugger, R., & Bean, M. (2022). Patterns of food security and dietary intake during the first half of the child tax credit expansion. Health Affairs 41, No. 5. https://doi.org/10.1377/hlthaff.2021.01864 [Cash Transfers Evidence Review Study O]
7 Batra, A., Jackson, K., & Hamad, R. (2023). Effects of the 2021 Expanded Child Tax Credit on adults’ mental health: A quasi-experimental study. Health Affairs 42, No. 1. https://doi.org/10.1377/hlthaff.2022.00733 [Cash Transfers Evidence Review Study Q]
8 Prenatal-to-3 Policy Impact Center (2026). The people behind early care and education. https://pn3policy.org.
9 Prenatal-to-3 Policy Impact Center (2026). The people behind early care and education. https://pn3policy.org.
10 Workman, S. & Capito, J. (2025). Estimating the true cost of child care in all 50 states. Prenatal to Five Fiscal Strategies. Retrieved October 8, 2025, from https://p5f-cdn-dev.s3.us-east-1.amazonaws.com/Brief_50statemodel_June2025_10f2faa4c2.pdf
11 Workman, S. (2021, June 28). The true cost of high-quality child care across the United States. Center for American Progress. https://www.americanprogress.org/article/true-cost-high-quality-child-care-across-united-states/
12 Tennessee Department of Human Services. (2025). Licensure rules for child care agencies (Chapter 1240-04-01). Tennessee Secretary of State. https://publications.tnsosfiles.com/rules/1240/1240-04/1240-04-01.20251120.pdf
13 National Academies of Sciences, Engineering, and Medicine. (2018). Transforming the Financing of Early Care and Education. Washington, DC: National Academies Press.
14 Workman, S., & Jessen-Howard, S. (2018). Understanding the True Cost of Child Care for Infants and Toddlers. Center for American Progress.
15 Office of Child Care (OCC), Administration for Children and Families (ACF), Department of Health and Human Services (HHS). Child Care and Development Fund (CCDF) Program. Part II: Rules and Regulations [Internet]. 81 Fed.
Reg. 67438 Office of the Federal Register, National Archives and Records Administration; Sep 30, 2016 p. 67091–899. Available from: https://www.govinfo.gov/app/details/FR-2016-09- 30/2016-22986
16 2024 Child Care and Development Fund (CCDF) Final Rule, 45 C.F.R. (2024). https://www.federalregister.gov/documents/2024/03/01/2024-04139/improving-child-care-accessaffordability-and-stability-in-the-child-care-and-development-fund-ccdf
17 Prenatal-to-3 Policy Impact Center. (2025). Child care subsidies. https://pn3policy.org/pn-3-state-policy-roadmap-2025/us/child-care-subsidies/
18 Tennessee Department of Human Services. (n.d.). Child care certificate program. Retrieved January 2026, from https://www.tn.gov/humanservices/for-families/child-care-services/child-care-payment-assistance/child-care-certificate-program.html
19 Pratt, E. (2025, August). Determining child care market rates in the state of Tennessee: FY 25 market rate survey. Tennessee Department of Human Services. The University of Tennessee, Boyd Center for Business & Economic Research. https://www.tn.gov/content/dam/tn/human-services/documents/FY%2025%20Market%20Rate%20Survey.pdf
20 Prenatal-to-3 Policy Impact Center. (2025). PN-3 state policy roadmap: Child care subsidies. Vanderbilt University. https://pn3policy.org/pn-3-state-policy-roadmap-2025/us/child-care-subsidies/
21 UnitedforALICE. (2023). The state of ALICE in Tennessee. https://www.unitedforalice.org/the-cost-of-basics/tennessee
22 Metro Nashville Public Schools. (2025). Certificated hourly salary schedule, 2025–2026 school year. https://www.mnps.org/careers/salaries-and-resources
23 Prenatal-to-3 Policy Impact Center (2026). The people behind early care and education. https://pn3policy.org.
Authors
Brief Prepared by:
Cynthia Osborne, PhD; Sierra Rowe, MPAff; Jennifer Huffman, MPAff; and Sean Craig, MA JD
Acknowledgements:
Kaeley Benson, PhD; Sarah Brown; and Monica G. Navarro
Recommended Citation:
Prenatal-to-3 Policy Impact Center (2026). What High-Quality Center-Based Child Care Really Costs, and Why No One is Paying It: Insights from True-Cost Modeling in Greater Davidson County, TN. https://pn3policy.org.


