
The prenatal to age 3 (PN-3) period is the most rapid and sensitive period of development, and it sets the foundation for long term health and wellbeing. The science of the developing child points to eight PN-3 policy goals that all states should strive to achieve to ensure that infants and toddlers get off to a healthy start and thrive.
To date, states have lacked clear guidance on how to effectively promote the environments in which children can thrive. This Prenatal-to-3 State Policy Roadmap identifies the 11 most effective evidence-based investments that states can make to foster equitable opportunities for infants and toddlers.
The Prenatal-to-3 State Policy Roadmap is a tool for your state to:
In this Roadmap summary, we provide a snapshot of the progress your state has made implementing each of the 11 effective policies and strategies over the last year. Additional details, including extensive information on the impact that each solution has on the eight PN-3 policy goals, the choices that states can make to effectively implement them, the progress states have made in the past year toward implementation, and how states compare to each other in their generosity and reach of the policies and strategies is provided in the full Roadmap in a longer profile for each policy and strategy.
A state’s policy choices do not operate in isolation from one another. Instead, they interact to create a system of support of varying generosity for parents and children. Tax credits and near-cash supports, such as SNAP, provide valuable resources to families. However, state minimum wage policies and child care subsidy policies are significant drivers of the variation across states in the amount of resources a working parent has available to support their family.
We simulate the level of annual resources available to a single parent with an infant and toddler, who works full time at a minimum wage job, and who uses a subsidy to leave their two children in center-based child care that charges the equal access target rate (which is the 75th percentile of the state’s market rate survey). The figure below combines a state’s minimum wage, out-of-pocket child care expenses (required copayments plus any additional fees), nutrition benefits, and tax credits to illustrate the level of resources available to this stylized family in your state.
We rank states from 1 to 51; with number 1 being the District of Columbia, in which the working parent has more than $46,000 in annual resources to provide for their family, and Georgia and North Carolina at spots 50 and 51, in which the same working parent has approximately $22,000 in annual resources, because of low minimum wages and high out of pocket child care expenses.
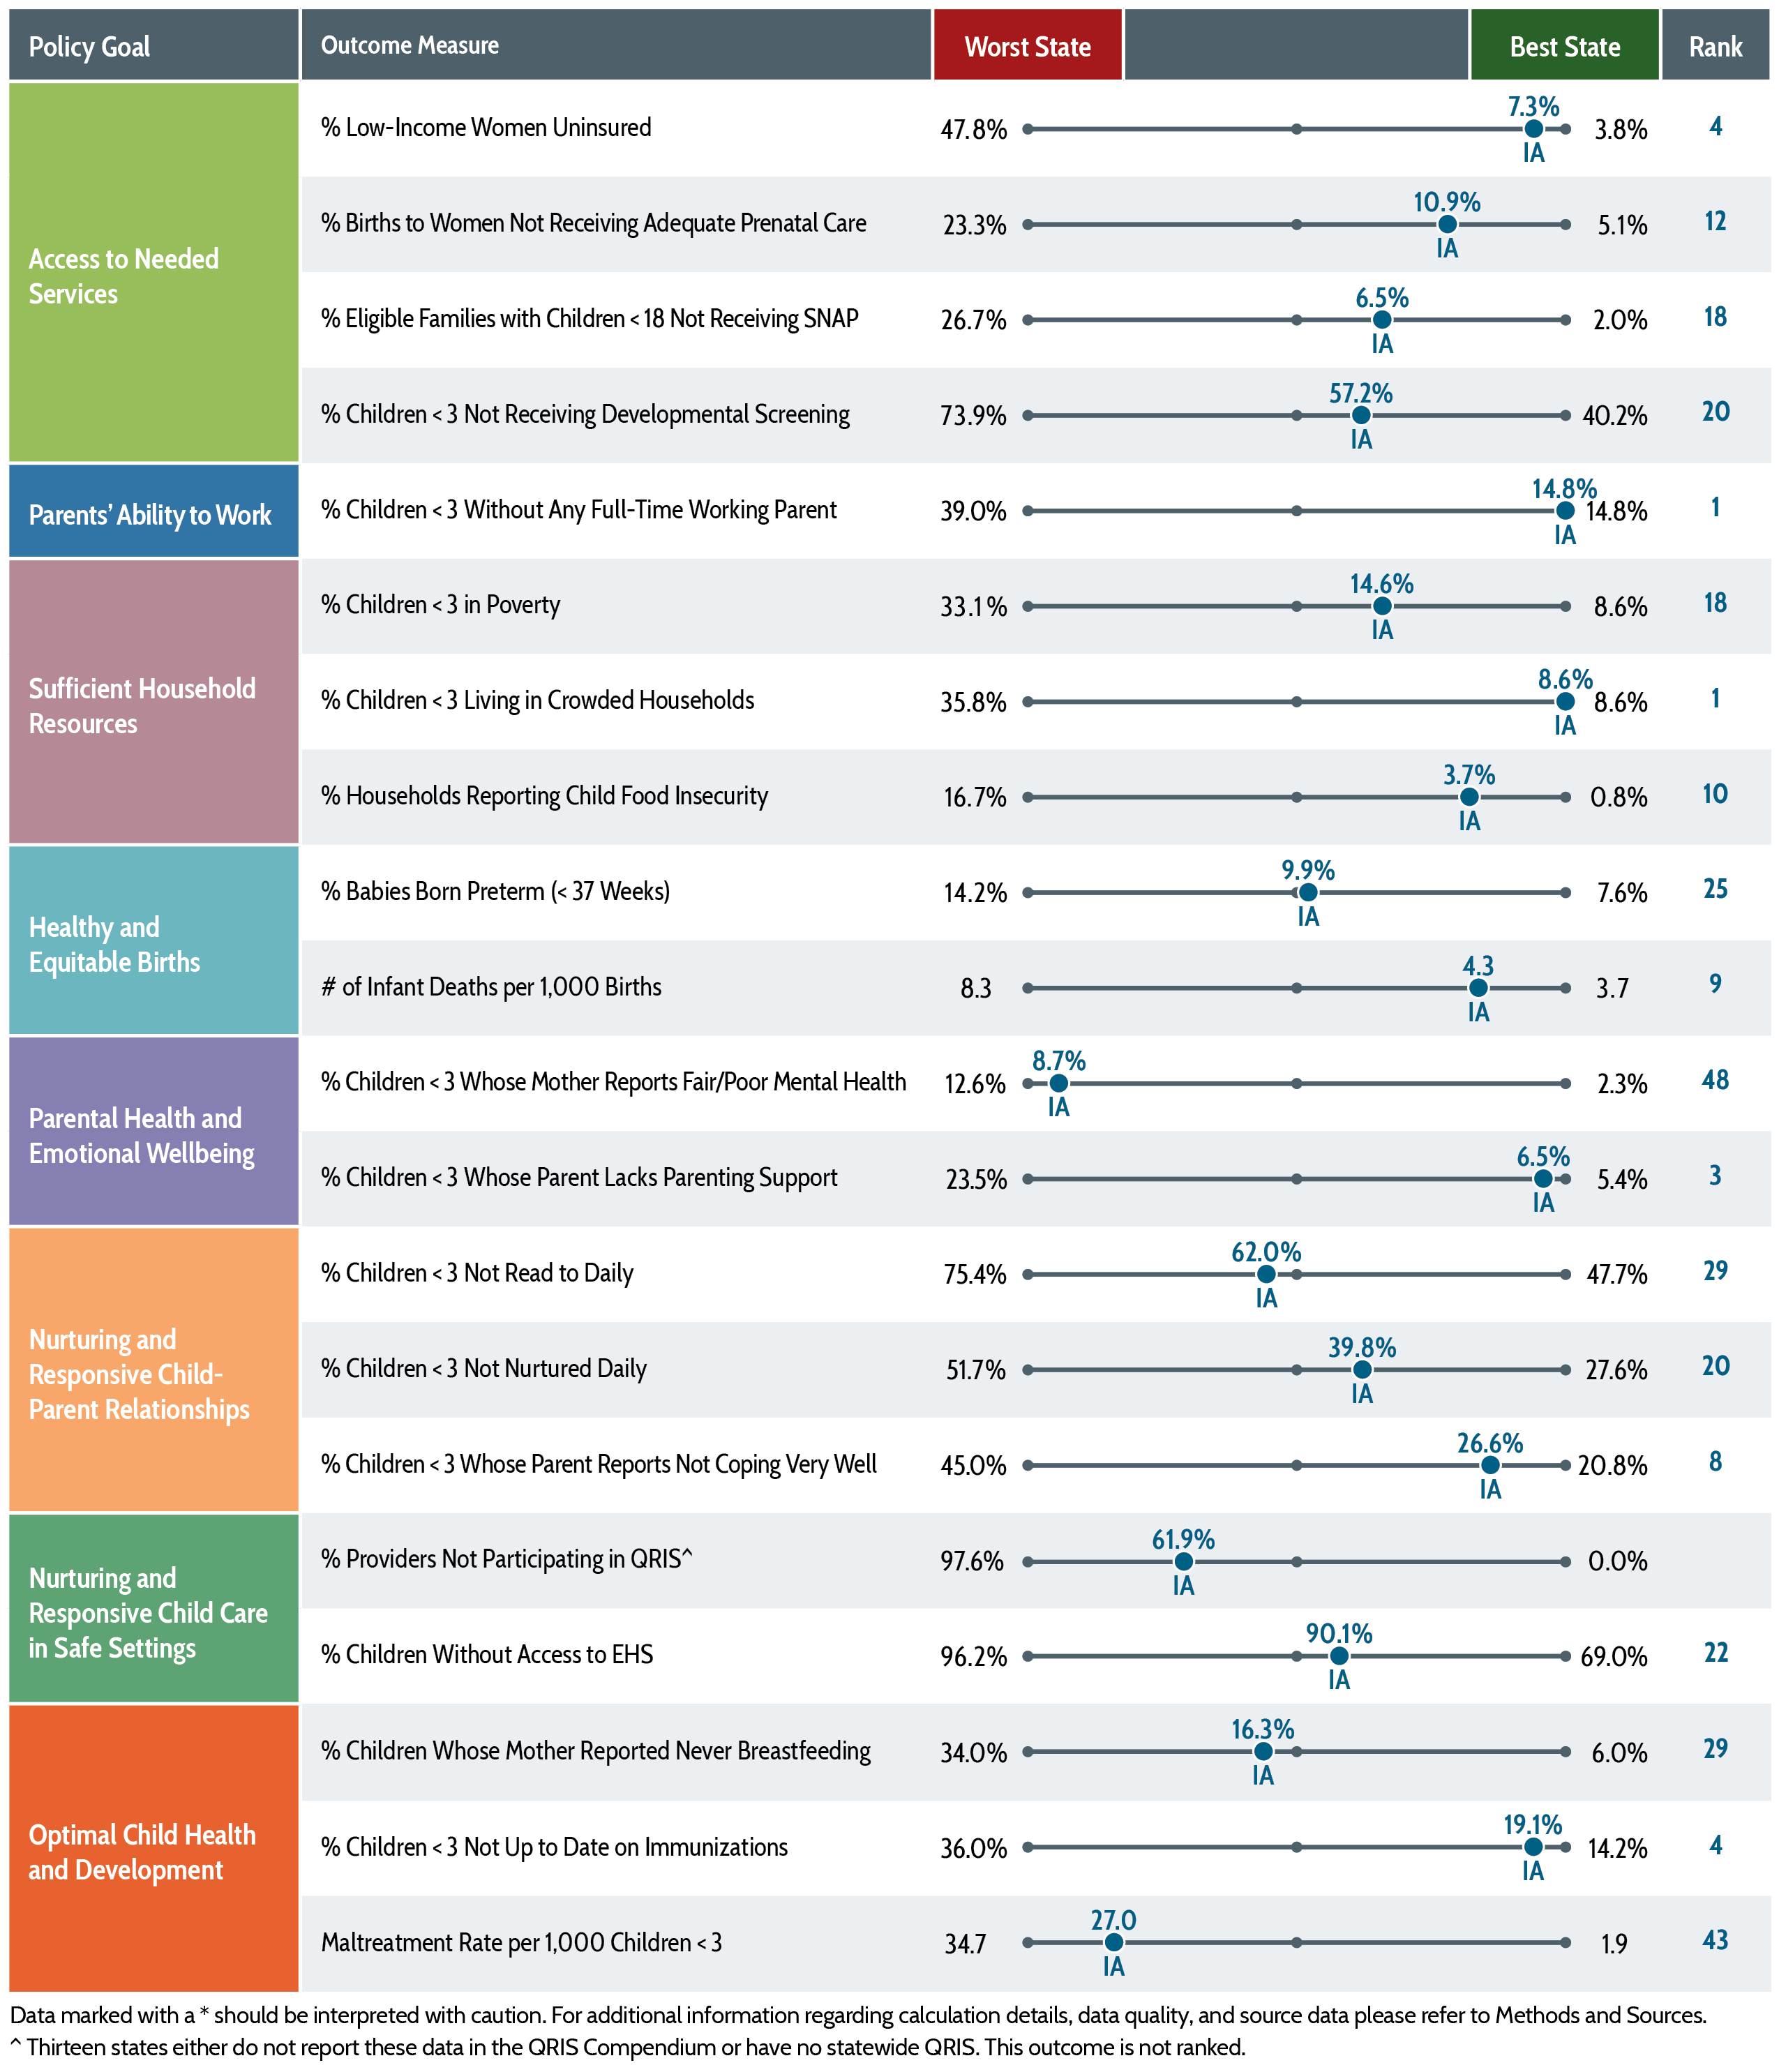
State policy choices influence the wellbeing of children and families. The data below illustrate the range on 20 outcome measures of child and family wellbeing between the state in which children and their parents are faring the best, and the state in which they are faring the worst, and demonstrates where your state fits within that range. These data can help your state prioritize its prenatal-to-3 policy goals and track the wellbeing of children and families.
The science clearly identifies the conditions necessary to help children thrive. The evidence now exists on how your state can invest in effective policies and strategies to foster these conditions. This Roadmap is meant to serve as a guide for your state as it undertakes these important efforts to ensure all children thrive from the start.