
The prenatal to age 3 (PN-3) period is the most rapid and sensitive period of development, and it sets the foundation for long term health and wellbeing. The science of the developing child points to eight PN-3 policy goals that all states should strive to achieve to ensure that infants and toddlers get off to a healthy start and thrive.
Comprehensive reviews of the most rigorous evidence available identified five state-level policies and six strategies that positively impact at least one of these PN-3 policy goals. When combined, the policies and strategies create a system of care that provides broad-based economic and family supports, as well as targeted interventions to address identified needs.
This Prenatal-to-3 State Policy Roadmap is guided by the framework below, which illustrates the alignment between the eight policy goals, the 11 evidence-based policies and strategies that impact each goal, and the outcomes that illustrate the wellbeing of children and families.
Tracking progress on the key PN-3 outcomes included in this Roadmap allows each state to determine the health and wellbeing of children and families in the state and to identify which PN-3 policy goals are lagging and should be prioritized. As states implement the solutions proven to impact their policy goals, assessing the wellbeing of infants and toddlers allows states to measure their progress toward achieving their PN-3 policy goals.
Each of the 11 effective solutions in the Roadmap are proven to impact at least one of the eight PN-3 policy goals (highlighted in the framework above). This summary provides dozens of data points and a snapshot of your state’s progress on adopting and implementing each policy and strategy. The Roadmap also provides more detailed information on each effective solution in the policy and strategy profiles.
For each of the five policies, the evidence points to a specific policy lever that states can implement to impact outcomes. For the six strategies, the evidence clearly links the strategy to PN-3 outcomes, but the current evidence base does not provide clear guidance on how states should implement each strategy to positively impact outcomes.
This Roadmap helps each state monitor its progress on all 11 effective solutions and on 20 child and family outcome measures that illustrate the health, resources, and wellbeing of infants, toddlers, and their parents in each state. The Roadmap also measures the progress states are making to reduce racial and ethnic disparities in access and outcomes. The 11 effective solutions are not implemented similarly across all states, leaving children and families across the US with a patchwork of benefits and unequal outcomes.
Six states have adopted and fully implemented all five effective policies. Connecticut and Washington joined California, the District of Columbia, Massachusetts, and New Jersey in fully implementing all five Roadmap policies. “Fully implemented” means that families in the state can currently access the level of benefits that rigorous research states is necessary to impact PN-3 outcomes. Ten states have fully implemented four out of the five policies. Yet, even among states that have implemented a given policy, the generosity and reach of the policy varies considerably across states, which is discussed in detail in each of the policy and strategy profiles. To date, six states—Georgia, Mississippi, North Carolina, South Carolina, Texas, and Wyoming—have not fully implemented any of the effective policies.
Since the release of the 2021 Roadmap, an additional eight states have fully implemented at least one of the five Roadmap policies—Virginia newly implemented two policies. Two states—Kentucky and Maryland—increased their recertification intervals for SNAP to 12 months; Connecticut fully implemented its 12-week paid family leave program; three states—Delaware, Nevada, and Virginia—fully implemented a state minimum wage of at least $10; and three states—Indiana, Virginia, and Washington—fully implemented a refundable EITC of at least 10% of the federal credit.
In addition to the progress of these eight states, many more states seriously considered legislation to adopt one of the evidence-based policies, passed legislation to enhance the benefits, or will fully implement one of the policies in the next few years.
For example, 11 out of the 12 nonexpansion states considered legislation to expand Medicaid. In North Carolina, negotiations are still ongoing in the legislature. In South Dakota, voters will consider a ballot measure in November 2022 to expand Medicaid.
Two states, Delaware and Maryland, enacted 12-week paid family leave programs that will be implemented in 2026 and 2025, respectively. And, although the states were not successful, 21 other states introduced legislation this past session to adopt a statewide paid family leave program of at least 6 weeks.
No states passed legislation this past year to enact a state minimum wage of $10.00 or greater. However, Nebraska will vote on a ballot measure in November 2022 to incrementally increase the state minimum wage to $15.00 by 2026, and Hawaii enacted legislation that will incrementally expand the state’s minimum wage (currently at $12.00) to $18.00 by 2028.
With regard to the state earned income tax credit, Hawaii enacted legislation to make its 20% state EITC refundable and permanent, effective tax year 2023, and seven states that had previously implemented a refundable state EITC of at least 10% enacted legislation to increase the generosity of the benefits or expand eligibility for the tax credits to additional populations.
States also invested in the evidence-based strategies this past year through legislative or administrative action. For example, New York made a substantial investment in increasing access to HealthySteps, one of the three evidenced-based comprehensive screening and connection programs. And, Maryland invested $72 million in Maryland Medicaid to implement the CenteringPregnancy group prenatal care model throughout the state.
In addition, over the last year, several states took legislative action to enhance their home visiting services, including California and Illinois which passed legislation to expand resources to families in the programs; and Rhode Island, Washington, Arkansas, and New Hampshire which increased their funding for home visiting programs.
Three states – Iowa, Massachusetts, and Oregon – made direct investments in Early Head Start this past year, with Oregon increasing the number of state-funded EHS slots by nearly 25%. And, six states – California, Delaware, Illinois, Massachusetts, New Jersey, and Pennsylvania – took legislative or administrative action to enhance their EI services.
The largest state investments were in child care subsidies. This past year, 17 states expanded their income eligibility thresholds, 15 states reduced their copayment requirements, and 35 states increased their reimbursement rates.
A state’s policy choices do not operate in isolation from one another. Instead, they interact to create a system of support of varying generosity for parents and children. Tax credits and near-cash supports, such as SNAP, provide valuable resources to families. However, state minimum wage policies and child care subsidy policies are significant drivers of the variation across states in the amount of resources a working parent has available to support their family. For example, states that set a high minimum wage, but also require parents to pay a high copay or additional fees for a child care subsidy may leave families with a similar level of available resources as parents in other states that provide a lower minimum wage, but do not require parents to pay a copay or fees for subsidized child care.
We simulate the level of resources available annually to a single parent with an infant and toddler, who works full time at a minimum wage job, and who uses a subsidy to leave their two children in center-based child care that charges the equal access target rate (which is the 75th percentile of the state’s market rate survey). The figures below combine a state’s minimum wage, out of pocket child care expenses, nutrition benefits, and tax credits to illustrate how the level of resources available to a stylized family varies across states. We also highlight how the level of resources available varies across states based on two other important state policy choices—Medicaid expansion and a paid family leave program of at least 6 weeks.
The figures illustrate wide variation in available resources due to state policy choices. In particular, the working parent has over $46,000 in annual resources to provide for their family in the District of Columbia, and the majority of these resources are their earnings from their minimum wage job. Additionally, the parent in the District of Columbia had access to paid family leave when their children were born, and they are eligible for Medicaid. By contrast, because of low minimum wages and high out of pocket child care expenses, this same working parent would have approximately $22,800 in annual resources for their family if they live in North Carolina or Georgia, and most of the resources are benefits that the government provides. The parent also does not have access to paid family leave or Medicaid.
The purpose of states’ implementing effective PN-3 solutions is to improve the wellbeing of infants, toddlers, and their parents, and to reduce long-standing disparities in outcomes by race and ethnicity.
Unfortunately, national data on many of these outcomes predate the pandemic because of quality concerns with data from the first year of the pandemic (2020), and 2021 data are not yet available. Nevertheless, the data provide an important portrait child and family wellbeing.
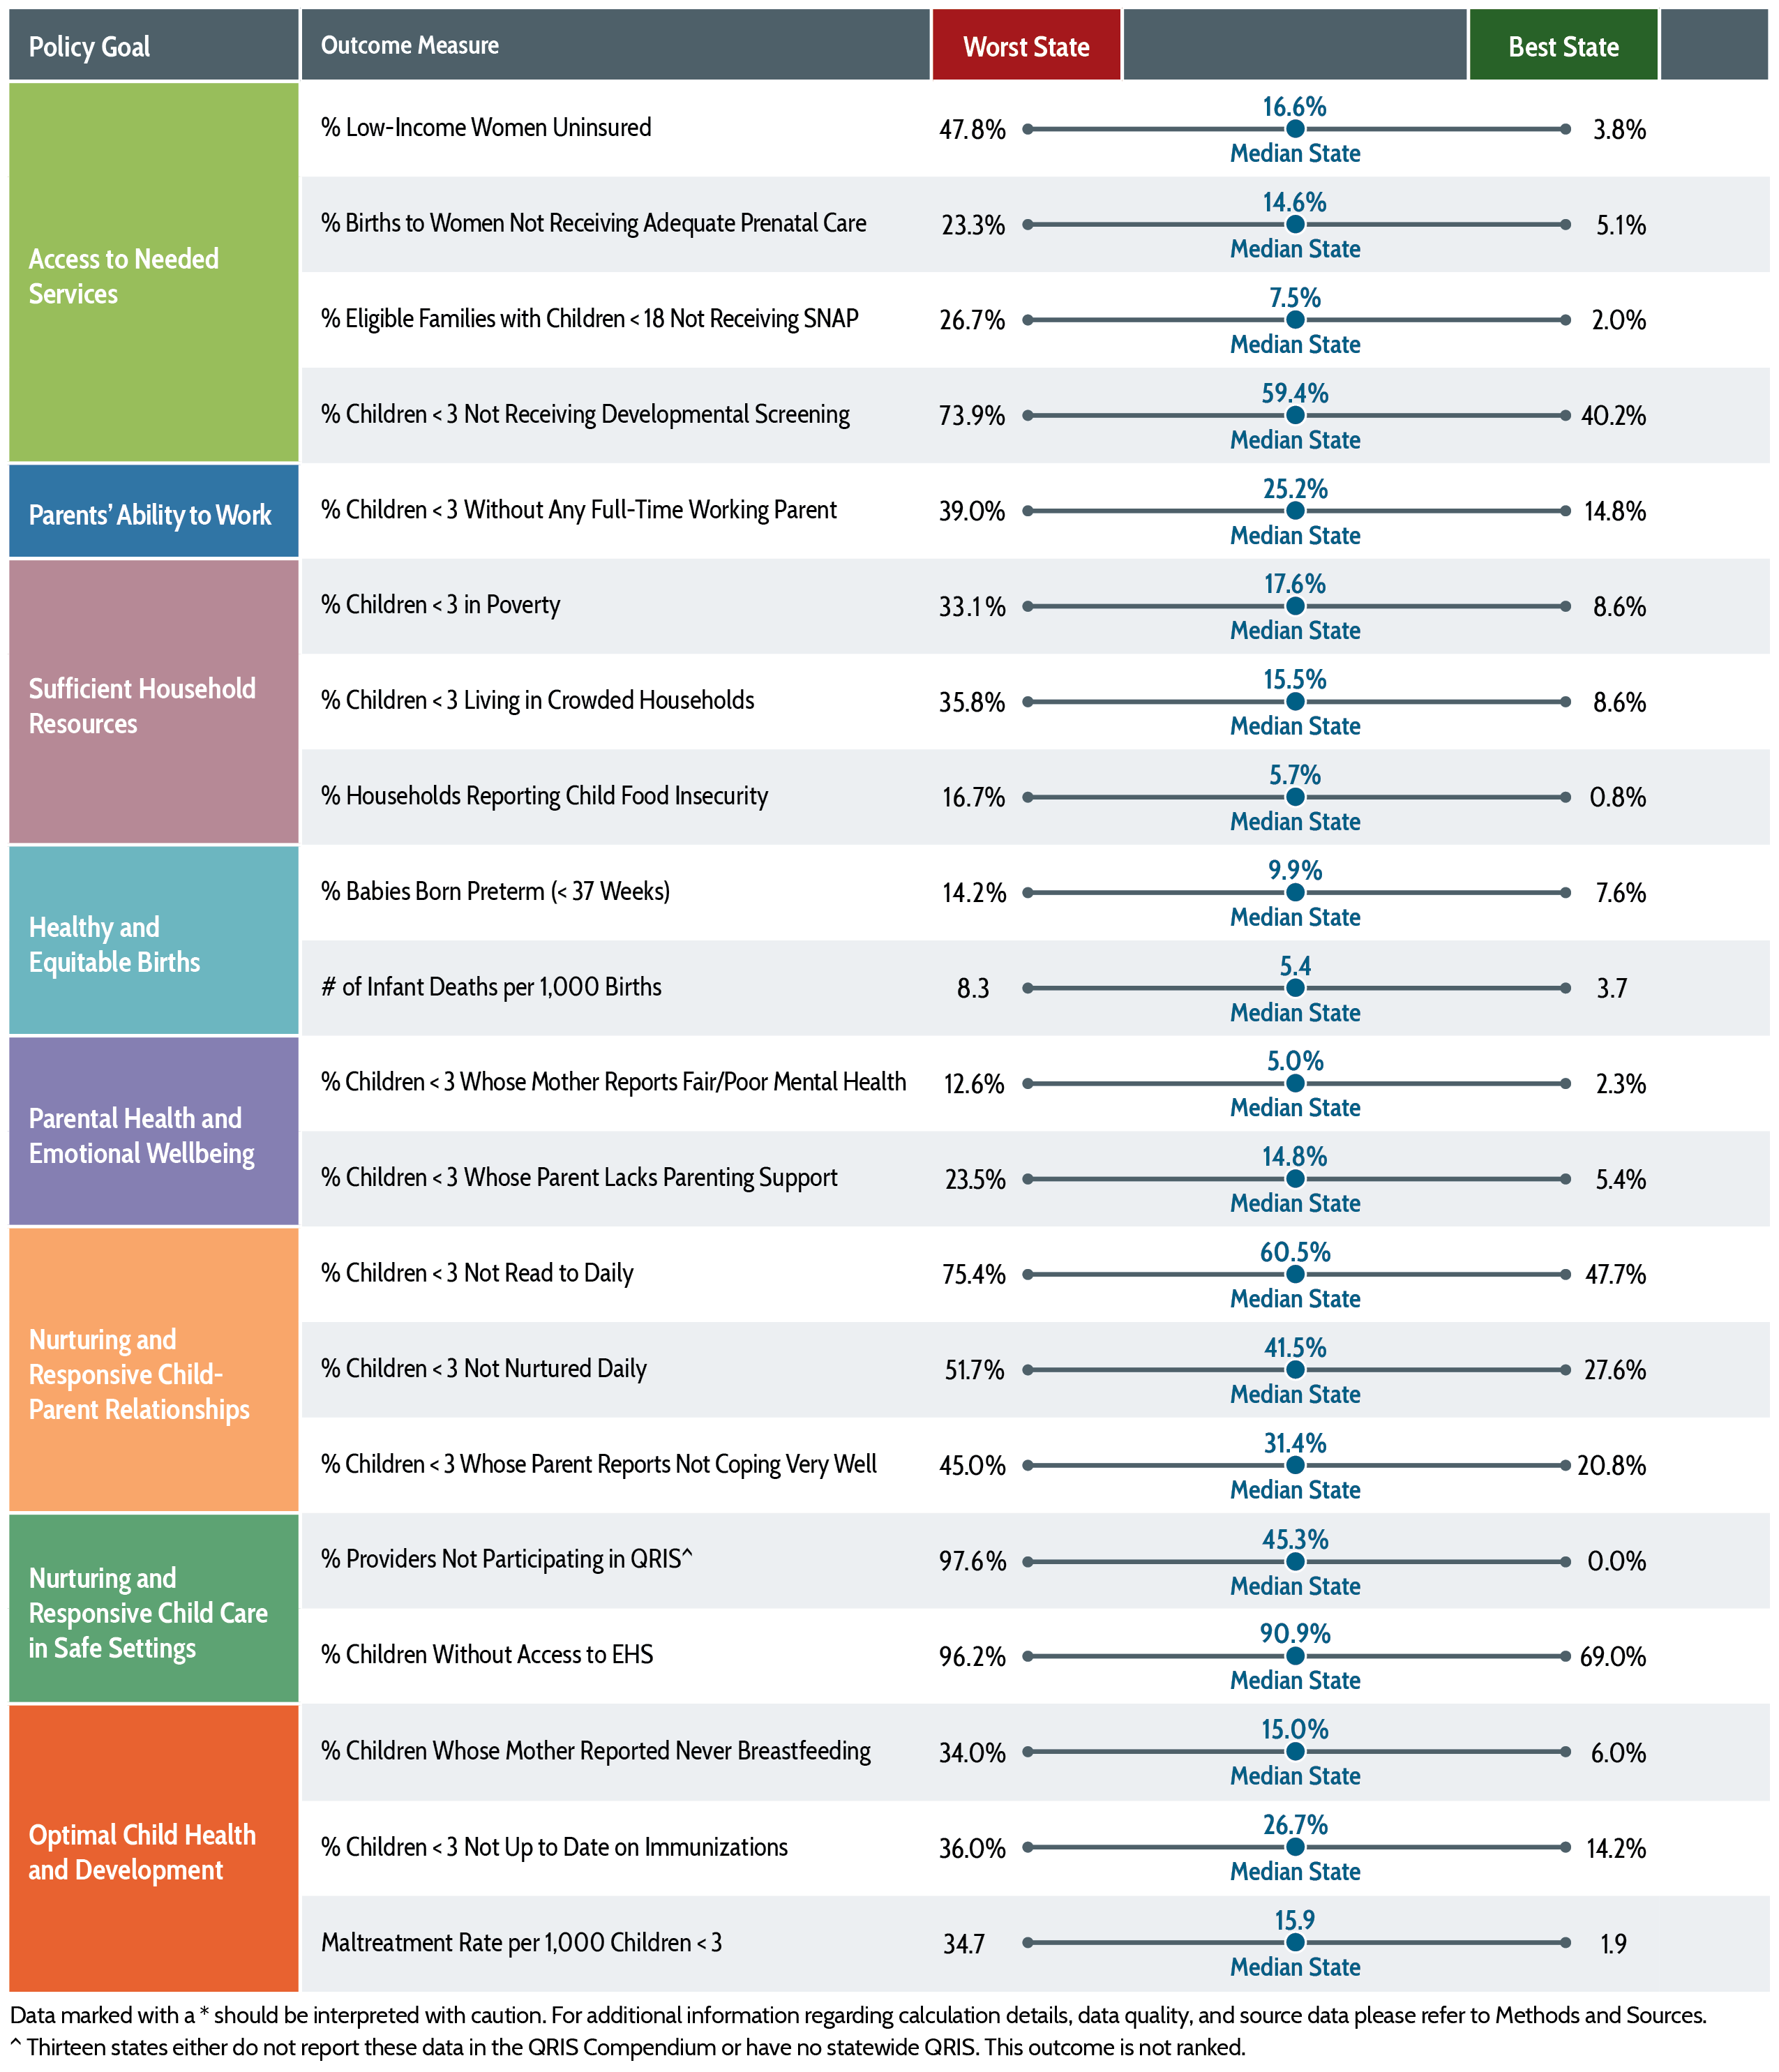
On some outcomes, such as preterm births, the percentage of children or families who are struggling in the states with the best outcomes is approximately half what it is in the states with the worst outcomes. However, on other outcomes, the differences are much larger. For example, the percentage of low-income women of childbearing age who lack health insurance in Texas (47.8%) is more than 12 times higher than it is in the District of Columbia (3.8%); and the rate of child maltreatment is 18 times higher in West Virginia than it is in Pennsylvania.
Importantly, the “best” state does not necessarily indicate a target for all other states to strive toward; even in the states with the best outcomes, many children and families are struggling. For example, Vermont reports the lowest, or best, percentage of children who did NOT receive a developmental screening, but in that state still 40% of children are not screened for potential delays that can identify the need for intervention. Connecticut has the best rate of children receiving all of their required immunizations, but more than 14% of infants and toddlers are not up to date on their immunizations. The daily reading outcome measure provides another example of an outcome on which all states can improve; Mississippi families report that over 75% of parents do not read to their infants and toddlers daily, which is the highest, or worst, percentage in the country. Maine families report the best rate of daily reading, but nearly half of young children are not read to daily in the state.
In addition to measuring how states compare to one another, it is vital that states collect and share information on how families of different race and ethnic groups and socioeconomic statuses fare on these outcomes. For most of these measures, national data are not available that can adequately measure subgroup differences within a state, because of small sample sizes. The US outcomes page, and the state-specific demographic characteristics section of the Roadmap provide detailed information on these important measures, and where possible, the data are presented by race and ethnicity.
The science clearly identifies the conditions necessary to help children thrive. The evidence now exists on how states can invest in effective policies and strategies to foster these conditions. This Roadmap is meant to serve as a guide for states as they undertake these important efforts to ensure all children thrive from the start.