
Introduction
Download the full brief to explore what the data reveal about the early childhood education workforce powering child care centers across greater Davidson County. Understanding who makes up this workforce is essential to addressing the staffing challenges that affect families, programs, and children.
High-quality child care is an essential resource for families and children. Reliable child care enables parental workforce participation, simultaneously providing children with a safe, nurturing, and structured environment that promotes healthy development.1 Quality child care also strengthens families’ economic stability, improving child developmental outcomes and promoting broader economic growth.2
Despite the essential need for child care, families face challenges accessing and affording it, and child care program directors face challenges recruiting and retaining educators and maintaining financially sustainable businesses.3 Though these challenges are widespread across the country, the key to implementing effective solutions requires understanding the specific local challenges within states and regions.
United Way of Greater Nashville engaged the Prenatal-to-3 Policy Impact Center (Policy Impact Center) at Vanderbilt University to conduct the Davidson County Child Care Landscape Study. The purpose of the study is to collect localized data to understand the strengths and challenges of the greater Davidson County child care system.
In Davidson County, Tennessee, which includes the capital city of Nashville, center-based child care is the most prevalent type of licensed child care available to families with children under age 5, and the local early childhood education (ECE) workforce is central to the functioning and quality of these centers.a,4 This brief examines the size and composition of the ECE workforce at center-based child care programs across greater Davidson County. It is one part of a five-part series presenting the findings of the Davidson County Child Care Landscape Study.
To gain insight into the workforce in greater Davidson County, the Policy Impact Center developed and fielded a survey to all 246 reachable center-based child care programs in the region during the summer of 2025. Of the reachable center-based programs, 47 percent (n=116) responded to the Davidson County Child Care Provider Experience Survey (Child Care Provider Survey) and provided sufficient information to be included in this analysis.
The sample used in the analyses is largely representative of the overall population of child care centers in the region. Throughout this brief, we use survey respondent results (n=116) to generate population-level estimates (N=246) to describe the center-based child care workforce and operating conditions, providing a new and detailed picture of the child care landscape across greater Davidson County.b
a Greater Davidson County has additional licensed child care options (e.g., home-based child care, drop-in child care, before and after school-only providers) that are excluded from the scope of this brief.
Background
High-quality child care supports positive child development as well as long-term education and labor-market outcomes. Child care also enables parents to participate in the workforce, generating broader economic and societal benefits as families become more productive and financially independent, and as children build the skills that underpin long-term, higher-skilled workforce participation.5
Families primarily experience child care as a private expense, and yet, the benefits of child care extend far beyond individual households. These widespread benefits, however, are not reflected in the market price of child care, producing systematic underinvestment in child care programs and the ECE workforce.6
Across the United States, child care tuition is often more expensive for families annually than in-state college tuition.7 Yet, the revenue generated from tuition is often barely enough to cover the operating expenses of running a child care program.8 To keep costs low, early childhood educators are paid below a living wage and have limited access to benefits such as health insurance and retirement plans.9 As a result, approximately one in three educators experiences food insecurity.10
Although demand for child care is widespread, the already high cost of care for families with young children often limits programs’ ability to raise tuition without pricing families out of the market. Because most child care programs rely primarily on private tuition revenue, constraints on what families can afford to pay result in thin operating margins, which in turn restrict resources for staffing, compensation, and other program investments.11
Educator compensation and benefits account for the largest share of child care operational costs (see Brief 4 for more details on the estimated cost of high-quality center-based care in greater Davidson County). Constraints in the tuition prices programs can charge parents directly result in low wages for early childhood educators and contribute to a high level of workforce turnover, which can lead to child care shortages, instability, and challenges maintaining quality within programs.12,13
By presenting data collected from child care directors about their program staff, operational features, and other key measures, the following findings build a more complete understanding of the ECE workforce and their programs across greater Davidson County.
b To review the complete methodology and approach for the Davidson County Child Care Landscape Study, refer to the online Methods Appendix.
4,226 Early Childhood Educators Work in Greater Davidson County, Supporting 22,184 Child Care Slots
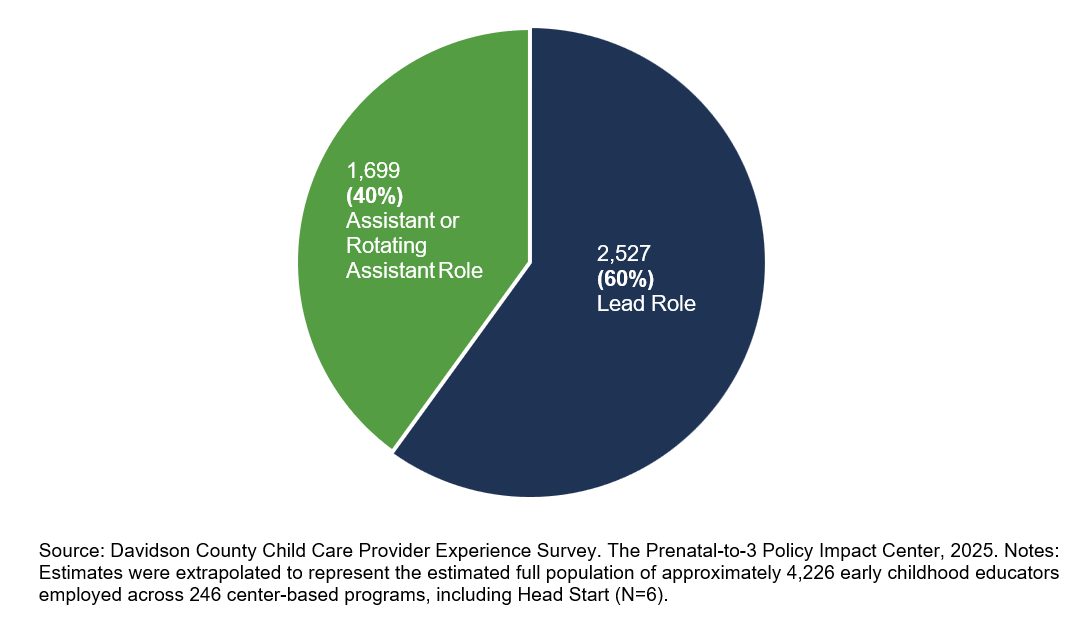
In the Child Care Provider Survey, we asked child care center directors to report the number of educators currently employed in their centers. Using these survey responses, we estimate that across the 246 centers in greater Davidson County, 4,226 early childhood educators dedicate their professional time and expertise to supporting the learning and development of the region’s youngest children. Among center-based educators, an estimated 60 percent (2,527 educators) serve in lead teacher roles, and 40 percent (1,699 educators) serve in assistant teacher or rotating assistant roles (see Figure 1).
c A full-day equivalent slot is defined as the care needed for one child enrolled for a full day or one slot shared by multiple children throughout the day (i.e., two part-time children).
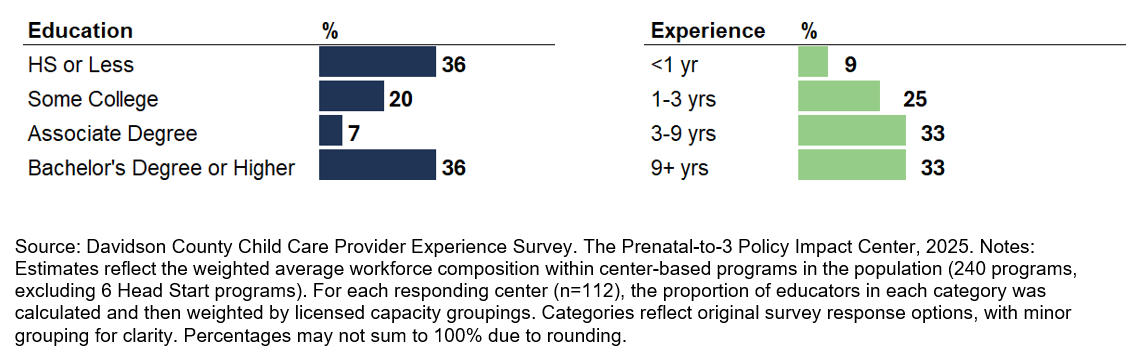
Greater Davidson County Early Childhood Educators Vary Widely in Their Education and Experience Levels
Center-based programs in greater Davidson County employ educators across a range of education levels and years of experience.e We estimate that, on average across programs, approximately one-third (36%) of educators hold a bachelor’s degree or higher, one-third (36%) have a high school diploma or less, and the remaining (27%) have some college or an associate degree, based on data provided on the Child Care Provider Survey (see Figure 2).
Greater Davidson County education levels are broadly consistent with national estimates, which indicate that approximately 30 percent of center-based teaching staff hold a bachelor’s degree or higher.15 We also estimate that, on average across programs, just 5 percent of educators hold a Child Development Associate (CDA) credential, well below the national estimate of approximately 29 percent of the ECE workforce holding a CDA credential.16
Similarly, center-based programs in greater Davidson County employ educators at various stages of their careers. In the average center-based program, on average, approximately one-third (34%) of early childhood educators have 3 years or less of experience, and approximately one-third (33%) have 9 or more years of experience.
Education levels of the ECE workforce vary by the neighborhood in which the center is located. Centers in higher-income neighborhoods employ a larger share of educators with a bachelor’s degree or higher compared to centers in middle- and lower-income neighborhoods. Specifically, in centers located in high-income communities (annual income >$152,000), the average center employs a workforce in which approximately half (52%) hold a bachelor’s degree or higher. In middle-income communities (annual income $76,000-<$152,000), the average center employs approximately one-quarter (22%) of educators with a bachelor’s degree or higher. In lower-income communities (annual income <$76,000), the average center employs less than one-third (30%) of educators with a bachelor’s degree or higher.
In contrast, educator tenure is more evenly distributed across the region. On average across center-based programs, approximately 3 in 5 educators have at least 3 years of experience, regardless of the neighborhood in which the center is located.
Although the findings above describe the current workforce, the policy environment shaping educator training opportunities is changing. TECTA (Tennessee Early Childhood Training Alliance) was a statewide program that provided tuition assistance and professional development support to early childhood educators. This program was recently eliminated following reductions in federal child care funding. The loss of this program may affect educators’ access to affordable pathways to postsecondary credentials in Davidson County, which may influence future credential attainment within the ECE workforce.
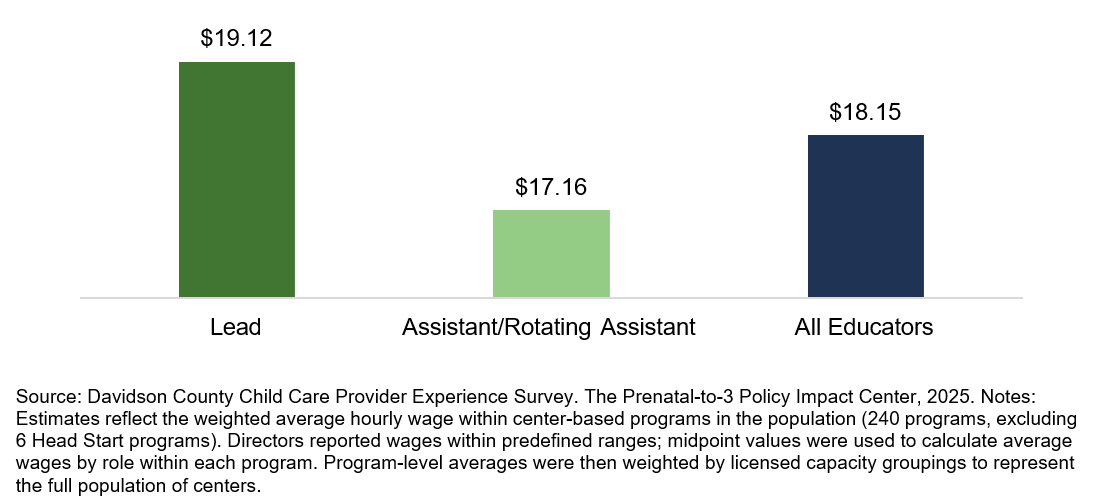
The Average Center Pays Wages of $19.12 for Lead Educators and $17.16 for Assistants, with Most Educators Earning Below the Local ALICE Survival Budget Threshold
Figure 3: The Estimated Average Center Hourly Wage of ECE Educators in Greater Davidson County, by Role
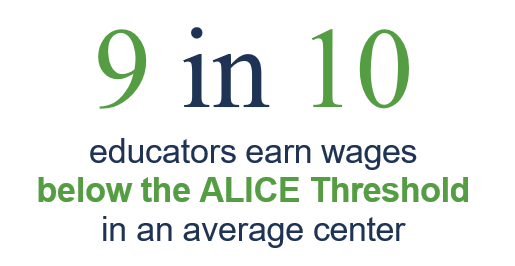
To assess whether wages in greater Davidson County are sufficient to cover basic living expenses, we compare educator wages to the local ALICE Household Survival Budget Threshold,h or the estimated minimum hourly wage required for a single adult living alone to meet basic needs without assistance.19 In Davidson County, the ALICE Threshold is $22.50 per hour, a threshold higher than many surrounding counties in Tennessee due to the higher cost of living in the Nashville metropolitan area.20
Across the region, we estimate that on average across center-based programs, approximately 91 percent of educators earn wages below the ALICE Threshold, meaning that approximately 9 in 10 educators earn less than the hourly wage needed to cover basic household necessities such as housing, food, or healthcare, without assistance, which is consistent with national trends.21
Wages vary across neighborhoods. Centers located in communities with average incomes above $152,000 pay higher average wages ($20.20 per hour) than centers in middle- and lower-income areas (approximately $16.60 per hour). Educators across all neighborhood income groups, however, continue to earn wages below the local ALICE threshold.
f Average wages are estimated using the midpoint of reported wage ranges. Directors reported wages as hourly amounts; the survey did not distinguish between hourly and salaried compensation; all wages were reported as hourly. Reported values represent the average wage paid within responding centers and are summarized as site-average wages across programs. See the online Methods Appendix for additional details.
g Metro Nashville Public School 2025 salary schedule can be found at https://www.mnps.org/careers/salaries-and-resources.
h ALICE is an acronym for Asset Limited, Income Constrained, Employed, and represents households with income above the Federal Poverty Level (FPL), but below the basic cost of living. The Household Survival Budget reflects the minimum cost of household necessities (housing, child care, food, transportation, health care, and technology) plus taxes, adjusted for all US counties and various household compositions.
High Turnover, Limited Benefits, and Narrow Operating Margins Shape Greater Davidson County Child Care Programs
More Than Half of Child Care Programs Lose at Least 20% of Educators Annually
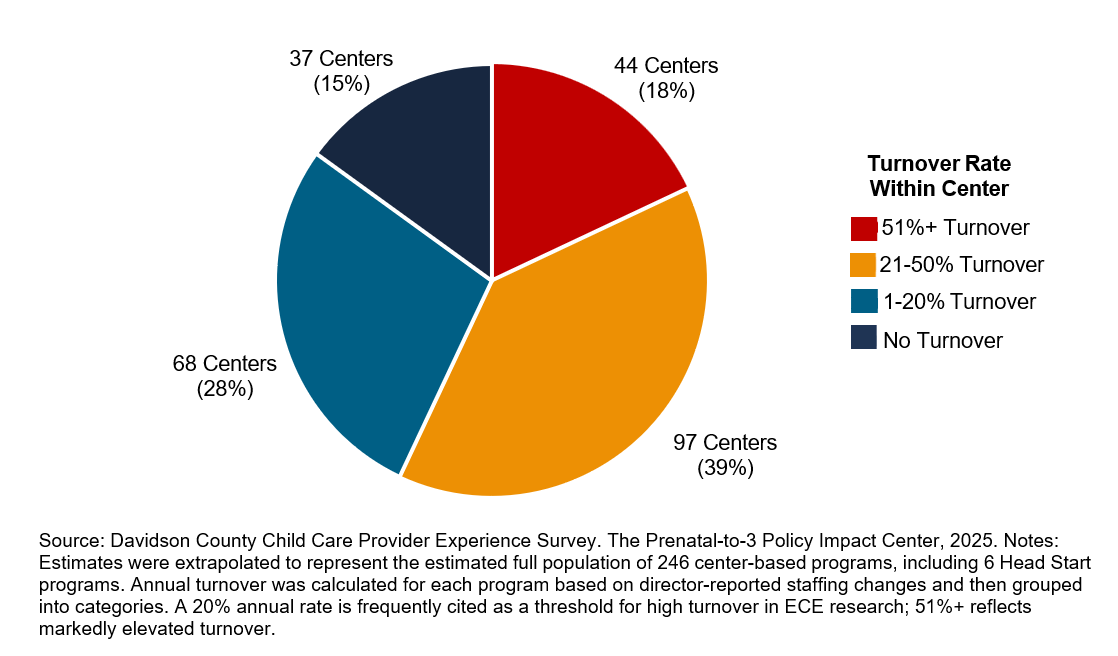
High educator turnover is a central issue across center-based programs in greater Davidson County. Based on data from the Child Care Provider Survey, we estimate that center-based programs experience an average annual turnover rate of 32 percent. Put differently, across center-based programs in the region, approximately one-third of educators employed leave their positions within 12 months.
Assessing turnover across individual centers shows how prevalent high turnover is in greater Davidson County. Using a 20 percent annual turnover threshold, a benchmark used in prior early childhood workforce research to indicate high turnover, we estimate that over half (57%) of center-based programs in the region experienced high turnover in the past year (see Figure 4).26,27,28
Turnover also varies across neighborhood contexts. Centers located in higher-income communities (average income above $152,000) experience an average annual turnover rate of 22 percent. In contrast, the average center in middle-income neighborhoods loses approximately half (50%) of its educators annually, and centers in lower-income neighborhoods lose approximately 41 percent of their educators annually.
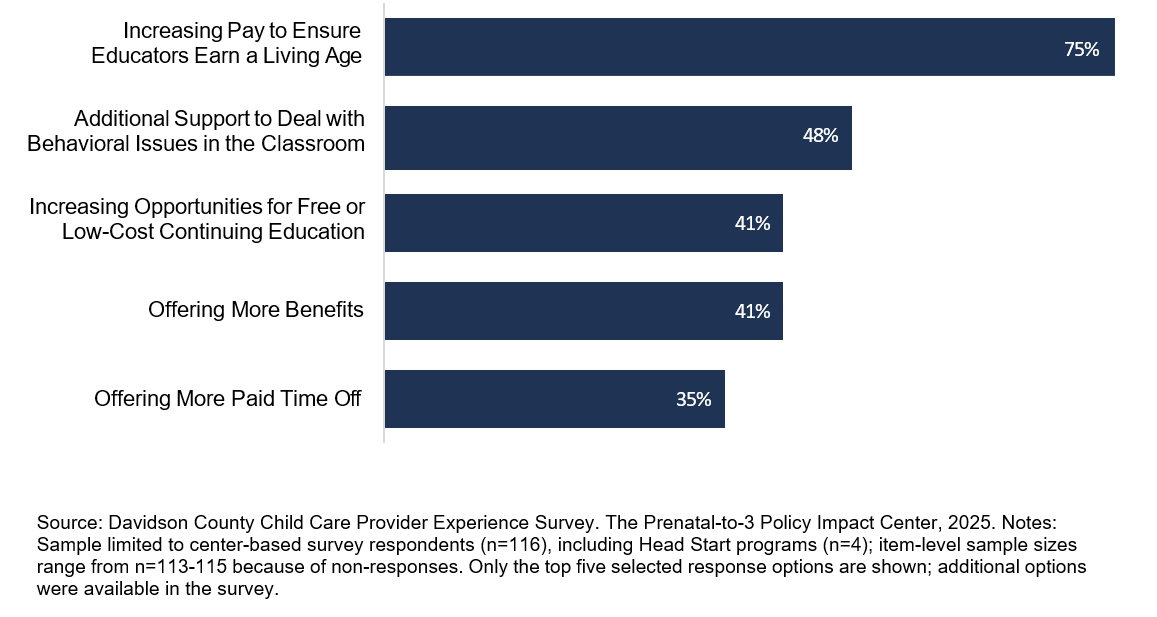
When asked in the Child Care Provider Survey which factors would help reduce turnover “a lot,” 75 percent of center-based directors indicate that increasing pay to ensure a living wage would help reduce turnover. Given that centers located in higher-income communities report higher wages and lower turnover rates than centers in middle- or lower-income communities, our results are consistent with directors’ reports on how to reduce turnover.
In addition to increasing wages, center-based directors note several other strategies that could help reduce turnover. Forty-eight percent of directors say that providing additional classroom behavioral supports would reduce turnover “a lot.” Approximately 41 percent of directors report that increasing opportunities for low-cost continuing education would reduce turnover, and approximately 41 percent report that offering additional benefits would meaningfully support educator retention (see Figure 5).
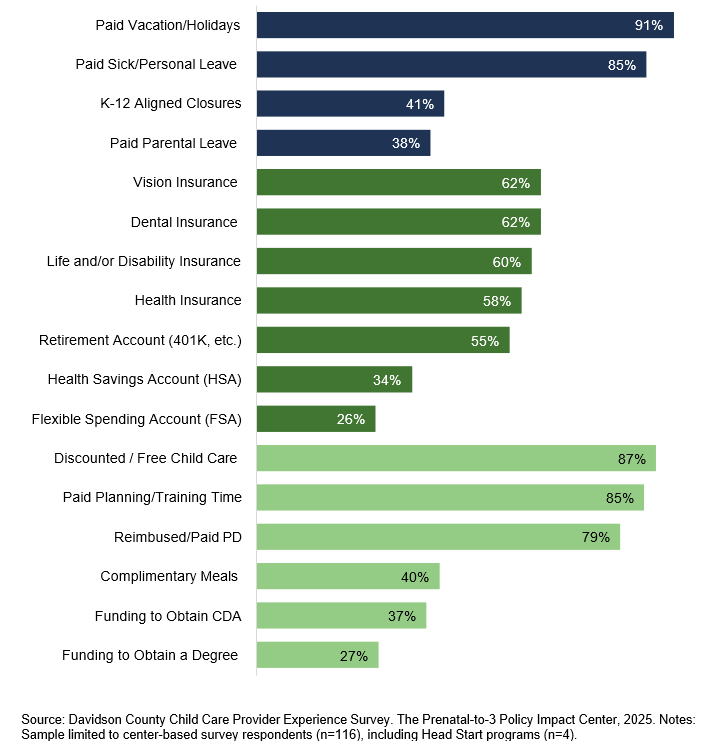
Most Programs Offer Some Workplace Benefits, But at Least 2 in 5 Centers Still Do Not Offer Access to Health Insurance or Retirement Plans
Workplace benefits offered to educators play an important role in retaining a high-quality ECE workforce.31,32 Across surveyed center-based child care programs, traditional employer-sponsored benefits such as paid leave for holidays, vacation time, and sick time for full-time educators are common: 91 percent offer paid vacation time, and 85 percent offer paid sick or personal leave.
In contrast, health and retirement benefits for full-time educators are offered less consistently. Just over half of programs offer health insurance (58%) or contribute to educators’ retirement accounts (55%). Fewer programs offer tax-advantaged savings options, such as a flexible spending account (FSA; 26%) or health savings account (HSA; 34%).
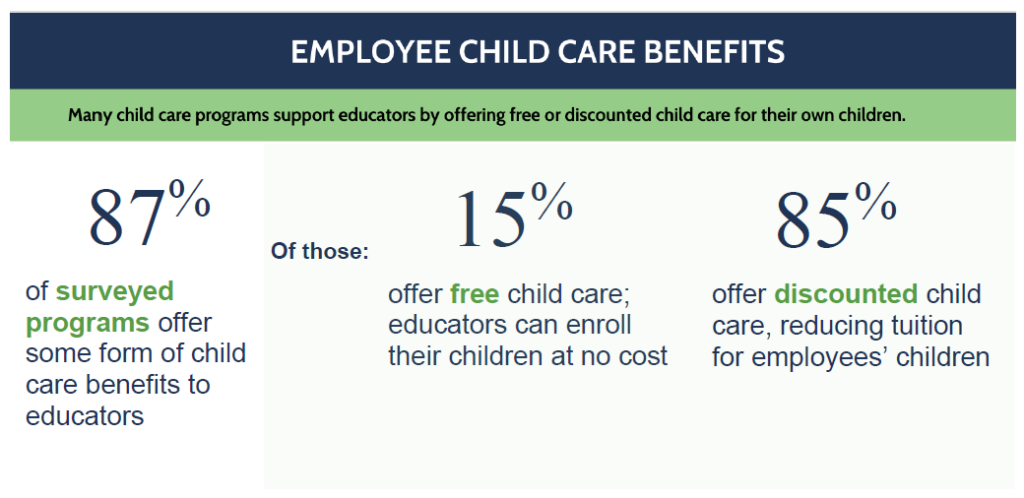
Child care programs more commonly offer educator-centered supports such as discounted or free child care for educators with young children (87%), paid planning or training time (85%), or professional development reimbursement (79%). Figure 6 summarizes the workplace benefits offered to full-time educators in surveyed center-based programs.
Figure 6: Percent of Center-Based Child Care Programs that Offer Workplace Benefits to Full-Time Educators
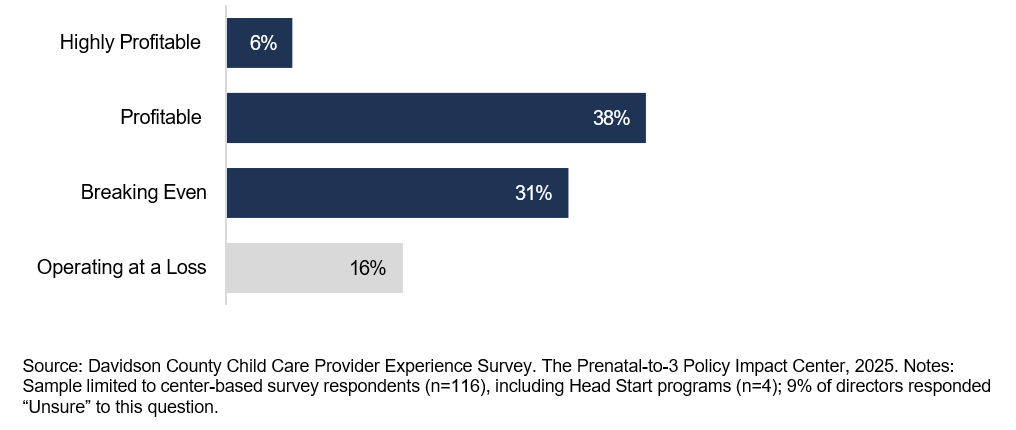
Just Under Half of Center-Based Child Care Programs Operate at a Profit
Although 16 percent of centers across greater Davidson County report operating at a loss in the last year, this number varies by neighborhood. Centers located in lower-income neighborhoods (average income below $76,000) report operating at a loss more frequently than centers located in middle- or higher-income areas, with 1 in 3 programs (30%) in lower-income areas reporting losses, compared to approximately 1 in 10 programs (9%-13%) in middle- and higher-income neighborhoods.
Whether a program is profitable (i.e., directors reported themselves as ‘Highly Profitable’ or ‘Profitable’) does not vary meaningfully across program characteristics. No key program characteristics, including tuition rate, certificate participation status, and the share of enrolled children receiving certificates, are correlated with profitability.
Even though 44 percent of surveyed programs describe themselves as profitable, self-reported profitability does not necessarily indicate substantial operating margins in the child care sector. Outside of the child care system, a net profit margin of 10 percent is considered average for a business, and margins below 5 percent are considered poor.33 National analyses indicate that child care businesses often operate on a profit margin below 1 percent.34
Importantly, true-cost modeling conducted for greater Davidson County assumes a minimum 5 percent operating reserve to support the financial stability of a child care program, well above what most child care programs achieve under current operating conditions (see Brief 4 for more details on the estimated cost of center-based high-quality care in greater Davidson County).
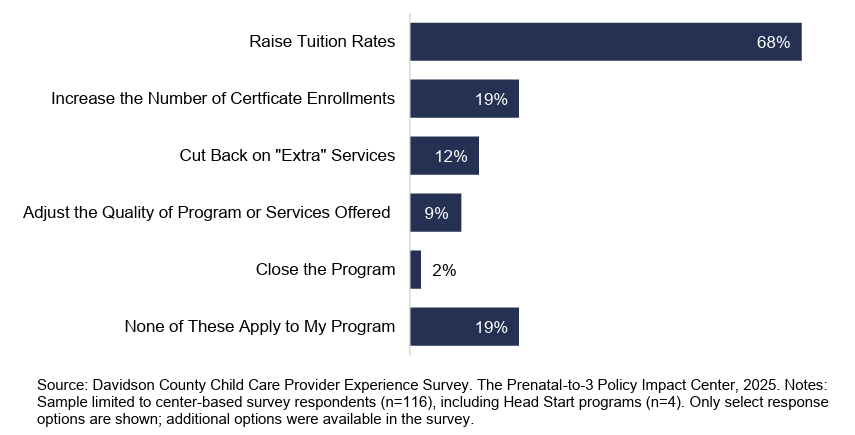
Reflecting these financial constraints, most surveyed child care directors report they will need to make adjustments soon in response to current financial and operating conditions. Most prominently, over the next 6 to 12 months, 68 percent of programs report they are likely to raise tuition rates (see Figure 8).
Overall, these findings illustrate the tenuous balance of running a child care business in greater Davidson County. Even among programs that report financial stability, many anticipate raising tuition for families in the near future.
Additionally, since data collection concluded, Tennessee has also experienced substantial reductions in federal child care funding. Specifically, the state received an approximately $44.5 million reduction in its annual Child Care Development Fund (CCDF) allocation.35 These reductions affect subsidy structures and workforce development supports, including professional development for providers, and further alter the financial context in which greater Davidson County programs operate, potentially placing additional pressure on program profitability.36
Conclusion
Across greater Davidson County, more than 4,000 educators support over 22,000 child care slots. Center-based programs generally employ educators with a range of education levels and years of experience. Still, staffing stability remains a challenge for the region, with more than half of centers losing at least 20 percent of educators annually.
The average child care center pays early childhood educators $18.15 per hour, which falls below the region’s ALICE Threshold, and fewer than 60 percent of programs offer their educators healthcare benefits. In addition, fewer than half (47%) of surveyed program directors report operating at a profit, and over half (57%) experienced high turnover in the past year.
Although these findings describe the child care system across greater Davidson County as a whole, the story varies across neighborhoods within the region. Centers located in higher-income communities tend to offer higher wages, experience lower turnover rates, and employ a larger share of educators with advanced credentials. Conversely, centers in lower-income communities more frequently report operating at a loss, tend to offer lower wages, and experience higher turnover rates.
Child care businesses face unique challenges in running their operations: they cannot simply raise prices to cover the rising cost of their services or to ensure they can pay staff a fair, living wage with benefits. Even modest tuition increases risk pricing families out of their services, particularly as families already face child care costs that exceed the average in-state college tuition in Tennessee.37
More than two-thirds of center-based child care program directors report plans to raise tuition prices within the next 6 to 12 months. Since data collection concluded, Tennessee has also experienced a reduction in federal child care funding, including cuts to CCDF funding, suggesting that programs may face greater financial pressure than reflected in these data.
Overall, these findings identify numerous strengths in the greater Davidson County child care system, with many programs employing educated, tenured educators and offering healthcare and retirement benefits despite financial constraints. Yet, the region’s child care system also experiences persistent turnover, low wages, and declining public investment – conditions that threaten the long-term stability and availability of affordable, high-quality child care for families across the region.
Further, we see meaningful differences in workforce conditions across neighborhoods. Centers in low- and middle-income neighborhoods may be facing the greatest challenges, with lower levels of educator qualifications, lower wages, and higher staff turnover. As greater Davidson County seeks to support the region’s ECE workforce, these differences highlight the importance of targeted approaches that ensure families across the region have access to qualified and well-supported educators.
Davidson County Child Care Landscape Study Resources
About the Davidson County Child Care Landscape Study
The United Way of Greater Nashville is engaging the Prenatal-to-3 Policy Impact Center at Vanderbilt University (Policy Impact Center) to conduct the Davidson County Child Care Landscape Study to examine child care supply, population metrics that inform demand, and the estimated cost of providing high-quality child care in Davidson County. The Davidson County Child Care Landscape Study consists of three phases.
- Phase 1 focuses on using state- and national-level publicly available data to understand the population and demographic characteristics of Davidson County that inform local child care demand and current supply. Though these data provided a foundational overview of the local child care landscape, they also revealed limitations in what could be understood without targeted data collection to provide more detailed, local data. A summary of key findings was released in March 2024.d
- Phase 2 consists of an in-depth child care supply analysis based on an original child care provider survey. The Policy Impact Center developed and fielded the 2025 Davidson County Child Care Provider Experience Survey (Child Care Provider Survey) between June and August 2025 to all licensed child care programs in the greater Davidson County area. A total of 130 (116 center-based and 14 home-based) out of 275 (246 center-based and 29 home-based) reachable child care programs participated in the Child Care Provider Survey (47% response rate) and provided sufficient information to be included in our analyses. We present findings from this phase throughout this five-part brief series. The Child Care Provider Survey asked about:
- Child care enrollment and open slots,
- Staffing, workforce characteristics, and educator wages,
- Child care program director experiences and challenges.
- Phase 3 uses a cost estimation model informed by Tennessee- and Davidson County-specific data and input from local child care experts and community partners to estimate the cost of providing high-quality child care in Davidson County. We discuss findings from this phase pertaining to center-based child care and home-based child care in Briefs 4 and 5, respectively, of this five-part series.
Results from the Nashville Child Care Landscape Study will inform child care expansion planning, resource allocation decisions, and policy and funding advocacy.
A complete description of the methods used in this brief can be found in the online Methods Appendix.
Who We Are
Prenatal-to-3 Policy Impact Center
The Prenatal-to-3 Policy Impact Center translates the science of the developing child into state-level policies that have the strongest evidence of improving outcomes for infants, toddlers and their parents. Based in Vanderbilt University’s Peabody College of Education and Human Development, the Center’s team of researchers and nonpartisan policy experts work with policymakers, practitioners, and advocates to navigate the evidence on solutions for effective child development in the earliest years. Learn more at www.pn3policy.org.
United Way of Greater Nashville
At United Way, we unite the community and mobilize resources so that every child, individual and family thrives. Together, we are working to create a community where every child receives a quality education, no one lives in poverty or poor health, and the most basic needs of our families are met. Serving the community for more than 100 years, United Way of Greater Nashville is also recognized as the founding chapter of the Alexis de Tocqueville Society, a now global giving society that has invested more than $10 billion in the work of United Ways worldwide. United Way of Greater Nashville is creating lasting change throughout Middle Tennessee. We are uniquely positioned to do this work by bringing individuals, businesses, nonprofits and government to the table to have the tough conversations, mobilize the resources and make the smart investments that will create lasting solutions for our region’s most pressing issues. Our service area includes Cheatham, Davidson, Dickson, Hickman, Houston, Montgomery, Robertson, Stewart and Williamson counties. Learn more at www.unitedwaygreaternashville.org.
Raising Readers Nashville
Raising Readers Nashville is a collaborative working to support systems change in the area of early childhood education. We serve the early childhood community by working to improve literacy in four domains of focus: Ready to Read, Literacy Skill Development, Family and Caregiver Engagement and Educator Support. We do this in four ways, incubator, a leader of active initiatives, convenor or accelerator where we partner with community and as champion to amplify the work of others. Learn more at www.raisingreadersnashville.org.
References
1 National Scientific Council on the Developing Child. (2012). The science of neglect: The persistent absence of responsive care disrupts the developing brain: Working Paper 12. http://www.developingchild.harvard.edu .
2 Osborne, C., Kresse, A., Skatter, N., Xu, N., Huffman, J., & Craig, S. (2024, July 15). Early investment, a lifetime of returns: Articulating the value of early childhood investments in Virginia. Prenatal-to-3 Policy Impact Center. https://pn3policy.org/early-investment-a-lifetime-of-returnsarticulating-the-value-of-early-childhood-investments-in-virginia/
3 Administration for Children and Families (ACF). (2024, October 24). Understanding families’ needs and preferences to advance measurement of equitable access to child care and early education. https://acf.gov/sites/default/files/documents/opre/opre-understanding-families-needs-preferences-oct24.pdf
4 Tennessee Department of Human Services. (2025). Find child care. https://www.tn.gov/humanservices/for-families/child-care-services/find-child-care.html
5 Prenatal-to-3 Policy Impact Center. (2025). Child care: From market failure to strategic investment. https://pn3policy.org.
6 Prenatal-to-3 Policy Impact Center. (2025). Child care: From market failure to strategic investment. https://pn3policy.org.
7 Tennessee Commission on Children and Youth. (2025). The state of the child in Tennessee 2025. https://www.tn.gov/content/dam/tn/tccy/documents/stateofthechild/2025SOCReportFinal.pdf
8 Center for the Study of Child Care Employment. (n.d.). Why do parents pay so much for child care when early educators earn so little? https://cscce.berkeley.edu/publications/infographic/why-do-parents-pay-so-much-for-child-care-when-early-educators-earn-so-little/
9 Herman, D. R., Shodahl, S., & Wilhalme, H. (2024). Risk factors for food insecurity among early childhood education providers: Time for a solution. International Journal of Environmental Research and Public Health, 21(9), 1131. https://pmc.ncbi.nlm.nih.gov/articles/PMC11431304/
10 US Bureau of Labor Statistics. (2025, April 24). Occupational employment and wage statistics. https://www.bls.gov/oes/current/oes399011.htm
11 Bailey, M., Sun, S., & Timpe, B. (2020). The economics of child care supply in the United States. US Department of the Treasury. https://home.treasury.gov/system/files/136/The-Economics-of-Childcare-Supply-09-14-final.pdf
12 University of California Berkeley Center for the Study of Child Care Employment. (2024). Early childhood workforce index 2024 the early childhood educator workforce. Center for the Study of Child Care Employment. https://cscce.berkeley.edu/workforce-index-2024/the-early-childhood-educator-workforce/early-educator-pay-economic-insecurity-across-the-states/
13 Coffey, M. & Khattar, R. (2022, September 2). The child care sector will continue to struggle hiring staff unless it creates good jobs. The Center for American Progress. https://www.americanprogress.org/article/the-child-care-sector-will-continue-to-struggle-hiring-staff-unless-it-creates-good-jobs/
14 Prenatal-to-3 Policy Impact Center (2026). Early education for the next generation: Understanding child care supply in greater Davidson County, TN. https://pn3policy.org.
15 Center for the Study of Child Care Employment. (2024). Early childhood workforce index 2024: Key findings.
University of California, Berkeley. https://cscce.berkeley.edu/workforce-index-2024/executive-summary/key-findings/
16 Fox, E. G., Purtell, K. M., Lang, S.N. (2025). Exploring Potential Factors Driving High Turnover Among Early Care and Education Teachers. Columbus, Ohio: Crane Center for Early Childhood Research and Policy & The Ohio State University.
17 U.S. Bureau of Labor Statistics. (2024). Childcare workers. Occupational Outlook Handbook. https://www.bls.gov/ooh/personal-care-and-service/childcare-workers.htm
18 Metro Nashville Public Schools. (2025). Certificated hourly salary schedule, 2025–2026 school year. https://www.mnps.org/careers/salaries-and-resources
19 United For ALICE. (2023). ALICE county reports: Tennessee. United Way of Northern New Jersey. https://www.unitedforalice.org/county-reports/tennessee
20 United For ALICE. (2024). ALICE in Tennessee: A study of financial hardship. United Way of Tennessee. https://www.unitedforalice.org/state-overview/tennessee
21 Center for the Study of Child Care Employment. (2024). Early childhood workforce index 2024. University of California, Berkeley. https://cscce.berkeley.edu/workforce-index-2024/
22 Whitebook, M., McLean, C., Austin, L.J.E., & Edwards, B. (2018). Early childhood workforce index – 2018. Center for the Study of Child Care Employment, University of California, Berkeley. https://cscce.berkeley.edu/wp-content/uploads/2022/04/Early-Childhood-Workforce-Index-2018.pdf
23 Whitebook, M., Phillips, D., & Howes, C. (2014). Worthy work, STILL unlivable wages: The early childhood workforce 25 years after the National Child Care Staffing Study. Center for the Study of Child Care Employment, University of California, Berkeley. https://cscce.berkeley.edu/wp-content/uploads/publications/ReportFINAL.pdf
24 Phillips, D., Austin, L.J.E., & Whitebook, M. (2016). The Early Care and Education Workforce. The Future of Children 26(2), 139-158. https://dx.doi.org/10.1353/foc.2016.0016
25 Grant, A. A., Jeon, L., & Buettner, C. K. (2019). Relating early childhood teachers’ working conditions and well-being to their turnover intentions. Educational Psychology, 39(3), 294–312. https://doi.org/10.1080/01443410.2018.1543856
26 Amadon, S., Lin, Y.-C., & Padilla, C. (2023). Turnover in the center-based child care and early education workforce: Findings from the 2019 national survey of early care and education. OPRE Report #2023-061 Office of Planning, Research, and Evaluation, Administration for Children and Families, US Department of Health and Human Services. https://acf.gov/sites/default/files/documents/opre/workforce_turnover_snapshot_apr2023.pdf
27 Whitebook, M., McLean, C., & Austin, L. J. E. (2016). Early childhood workforce index – 2016. Center for the Study of Child Care Employment, University of California, Berkeley. https://cscce.berkeley.edu/files/2016/Index-2016.pdf
28 Amadon, S., Lin, Y.-C., & Padilla, C. (2023). Turnover in the center-based child care and early education workforce: Findings from the 2019 national survey of early care and education. OPRE Report #2023-061 Office of Planning, Research, and Evaluation, Administration for Children and Families, US Department of Health and Human Services. https://acf.gov/sites/default/files/documents/opre/workforce_turnover_snapshot_apr2023.pdf
29 Bryant, D., et al., (2023). Retention and turnover of teaching staff in a high-quality early childhood network. Early Childhood Research Quarterly, 65, 159-169. https://doi.org/10.1016/j.ecresq.2023.06.002
30 Vicente, D., Venegas, M. & Guerrero, A.D. (2025). Turn-over and retention among Head Start educators. Early Childhood Educ J. 53, 1467–1478. https://doi.org/10.1007/s10643-024-01685-x
31 Vicente, D., Venegas, M., & Guerrero, A. D. (2025). Turn-over and retention among Head Start educators. Early childhood education journal, 53(5), 1467-1478.
32 Holochwost, S. J., DeMott, K., Buell, M., Yannetta, K., & Amsden, D. (2009, October). Retention of staff in the early childhood education workforce. In Child & Youth Care Forum (Vol. 38, No. 5, pp. 227-237). Boston: Springer US.
33 Vipond, T. (n.d.). Profit margin. Corporate Finance Institute. https://corporatefinanceinstitute.com/resources/accounting/profit-margin/
34 U.S. Department of the Treasury. (2021). The economics of child care supply in the United States. https://home.treasury.gov/system/files/136/The-Economics-of-Childcare-Supply-09-14-final.pdf
35 Tennessee Department of Human Services. (2025). Update on child care funding. Retrieved January 2026, from https://www.tn.gov/humanservices/for-families/child-care-services/update-on-child-care-funding.html
36 Congressional Research Service. (2023). The Child Care and Development Block Grant: Background and funding
(R47312). https://www.congress.gov/crs-product/R47312
37 Tennessee Commission on Children and Youth. (2025). The state of the child in Tennessee 2025. https://www.tn.gov/content/dam/tn/tccy/documents/stateofthechild/2025SOCReportFinal.pdf
Authors
Brief Prepared by:
Cynthia Osborne, PhD; Monica G. Navarro; and Sierra Rowe, MPAff
Acknowledgements:
Jennifer Huffman, MPAff; Kels Bowman, PhD; Kaeley Benson, PhD; and Sarah Brown
Recommended Citation:
Prenatal-to-3 Policy Impact Center (2026). The People Behind Early Care and Education: Understanding the Early Childhood Workforce in Greater Davidson County, TN. https://pn3policy.org.

