The Roadmap is best known for its 12 evidence-based policy solutions, but did you know we track all 50 states and the District of Columbia on 20 measures of child and family health and wellbeing? That means we have over 1,000 data points in the Roadmap to show which states are leading or lagging on outcomes. Each outcome measure is theoretically and empirically aligned to one of the eight prenatal-to-3 (PN-3) policy goals. States can access their outcome data in two ways: 1) as a snapshot of how a state is doing across all 20 outcomes relative to the best and worst states; and 2) a snapshot of each outcome across all 50 states and the District of Columbia. The Roadmap’s state-specific outcome data are an invaluable tool policymakers can use to set evidence-based policy priorities.
A Snapshot of Your State Across All Outcomes
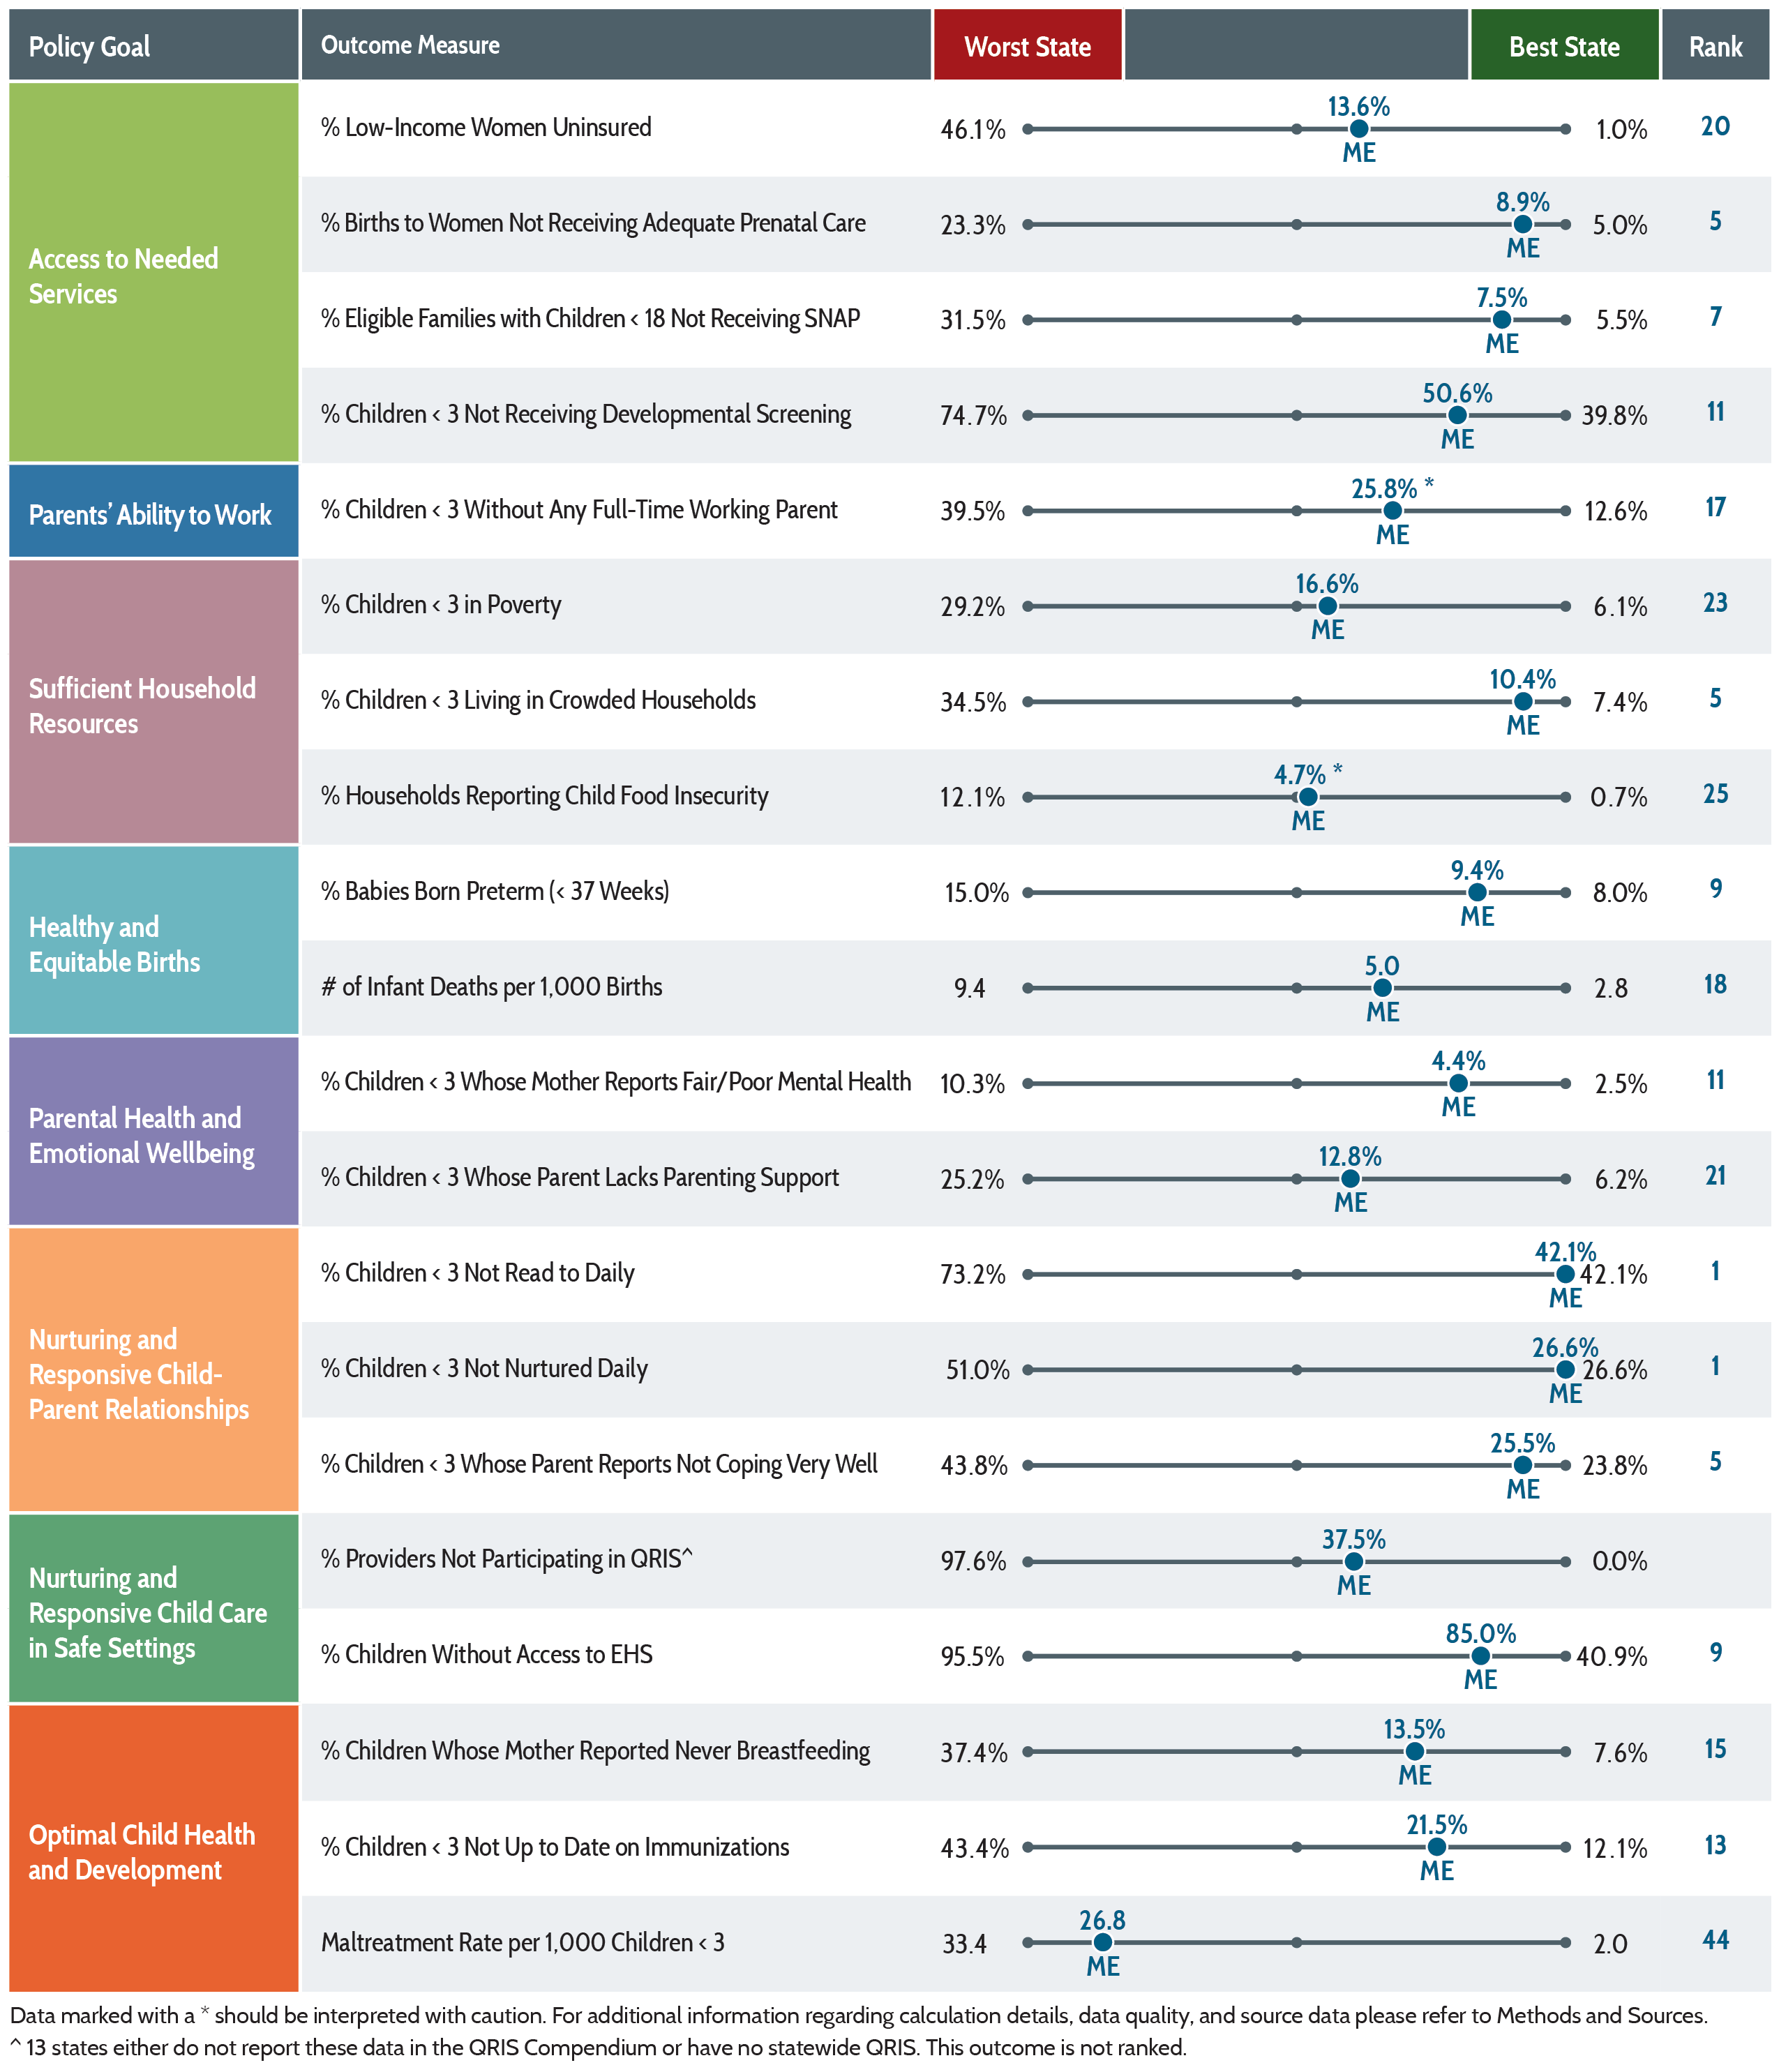
Each state’s Roadmap summary includes a snapshot of your state’s performance relative to others across all 20 outcomes. Select your state from the pull-down menu at the top left of the Roadmap. On your state’s Roadmap summary page, scroll to the bottom to find a graphic that looks like the one shown here for Maine, an example we will return to later.
Prenatal-to-3 Outcomes to Measure Impact in Maine
At a glance, this graphic provides an idea of where your state is performing well relative to the leading, lagging, and median states, as well as its rank out of 51 states (including the District of Columbia). Outcomes for which your state lags relative to others present the greatest opportunity for improvement through evidence-based policy changes.
For some outcome measures, even the leading states have room for improvement. Maine, for example, is leading the way in daily reading. In the 2023 Roadmap, compared to all other states, Maine had the lowest percentage of children under age 3 not read to daily, at 42.1% (in other words, more than half of children under the age of 3 were read to daily). Though Maine ranks first among states for this outcome, this still leaves two out of every five children in the state without daily exposure to reading, an important contributor to healthy brain development. Despite Maine’s relatively positive performance on daily reading exposure, policymakers in the state might still prioritize improving this outcome.
A Snapshot of Each Outcome Across All States
For each of the 20 outcomes, the Roadmap also provides a snapshot that includes the data for all 50 states and the District of Columbia, as well as data for the US population overall, and by race and ethnicity. These outcome snapshots are organized by the policy goal with which they align.
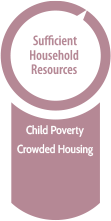
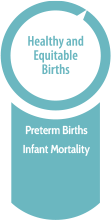
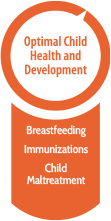
In the graphic below, click on a goal to explore the associated outcomes data:
For example, to see how your state performs relative to others on child poverty, navigate to the page for the Sufficient Household Resources goal and scroll down to view the percentage of children under the age of 3 living in poverty. You can see that there is wide variation in this outcome by state; 28 states and the District of Columbia perform the same or better than the national average of 18.3%, and 22 states perform worse.
States may see that they are lagging on multiple outcomes aligned with the same PN-3 policy goal, making a strong case for prioritizing improvement on that policy goal in their state.
Tools to Support Your State
Check in on the young children in your state! Explore the Roadmap’s data on health and wellbeing outcomes.