• Evidence Review Findings:
  • Needs Further Study
Review Method

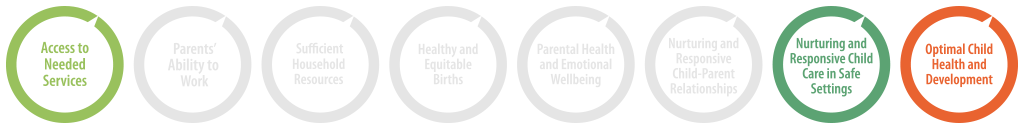
Child care quality rating and improvement systems are theoretically aligned with these policy goals:

Child care quality rating and improvement systems (QRIS) need further study before conclusions can be made about their impact on outcomes during the prenatal-to-3 period. Limited causal evidence suggests that low QRIS ratings may decrease enrollment in lower-quality child care programs and lead to quality improvement among child care providers. QRIS are relatively new systems, and more research is needed to causally assess the impact of these systems on the prenatal-to-3 period and to provide policy guidance to states on QRIS. Future causal research should address the link between QRIS, quality levels, quality improvement, and how QRIS ratings affect family decision making around child care, which may subsequently impact child health and development.

State efforts to increase quality in early care and education (ECE) settings are often reflected in their quality rating and improvement systems (QRIS), which are methods of systematically assessing and communicating the level of quality of care in ECE settings to a variety of audiences. States have the ability to design QRIS differently to meet the goals in their state, such as through which child care providers participate, how to define the components of child care quality included in QRIS ratings, how to score and rate providers, and what incentives for meeting higher level of quality standards to include. By providing a single, easy-to-understand quality rating for ECE providers, QRIS may provide valuable information to families seeking to enroll their children in higher-quality care. QRIS may also increase the supply of higher-quality ECE providers, by incentivizing providers to increase quality through the provision of information, technical assistance, and financial incentives. If the number of high-quality ECE providers grows over time and families move children into higher-quality care environments, this may lead to improved child health and developmental outcomes as more children are served in high-quality ECE settings.

Early care and education (ECE) policy increasingly focuses on improving the qualityof programs, due in part to the body of research demonstrating the potential for high-quality ECE programs to make positive impacts on children’s development and life trajectories.1 State efforts to increase quality in ECE are reflected in quality rating and improvement systems (QRIS), which are methods of systematically assessing, improving, and communicating the level of quality of care in ECE settings to a variety of audiences, including ECE programs, administrators, policymakers, and families.2 States have differing goals in implementing QRIS, typically including recognition and improvement of quality within the ECE system, ECE workforce professionalization, family engagement, and improvement of child outcomes, among others.2,3 Through QRIS, states establish a set of quality standards that are higher than state licensing standards, and they rate participating providers, offer technical assistance and financial incentives (e.g., bonus payments, tiered subsidy reimbursement rates) to providers to meet higher levels of quality standards, and communicate simple overall quality indicators to the public.A,2

QRIS vary greatly in design; states have policy leverage to design QRIS differently to meet the goals of QRIS in their state. For example, QRIS participation may be voluntary or mandatory, different types of programs may be eligible to participate in QRIS (e.g., center-based, home-based, Head Start, public pre-K), and states may design rating structures differently, including how programs are scored and what standards and indicators are used in creating the rating (such as child-to-staff ratios, curriculum, observed quality of the environment, and staff qualifications, among others).4,5 States may also specifically address quality among infant and toddler providers by establishing QRIS features specific to this population of children (e.g., curriculum and developmental screenings guidelines for infants and toddlers).6

Who Is Affected by QRIS?

As of fall 2019, 42 statesii have statewide or locally-administered QRIS,6,7 so the impact of these systems is far reaching. The percentages of eligible programs participating in each state vary widely, from less than 5 percent in some states to 100 percent in states with mandatory participation for eligible licensed providers.6 If participation in QRIS is high, these systems have the potential to impact millions of children served in ECE programs. To the extent that QRIS require or encourage participation by programs receiving public funding (e.g., subsidy funding, Early Head Start, Head Start, public pre-K), QRIS may also impact millions of low-income children served in ECE programs.

What Are the Funding Options for QRIS?

Funding for QRIS at the state level has historically come from a variety of sources. For example, past federal programs such as Race to the Top-Early Learning Challenge (RTT-ELC) and Preschool Development Grants provided dedicated funding for quality improvement efforts;A RTT-ELC grants are credited with spurring growth in QRIS.6,8 More recent federal funding available to support QRIS includes Preschool Development Grants Birth Through Five (renewal grants specifically highlight QRIS and capacity building for infants and toddlers)9,10 and increased funds from the reauthorization of the Child Care Development Block Grant.11 Many states rely primarily on federal and state matching funds from the Child Care and Development Fundiii to support QRIS; states may also use pre-K and education set-asides, philanthropic funding, or local funding mechanisms to support ECE quality initiatives.12,13 Funding for high-quality ECE may also be provided by a variety of state and local tax mechanisms.14


  1. “Quality” is often conceptualized into components of “structural” and “process” quality. Structural features of quality are the aspects of the child care environment that can be legislated or mandated, such as child-to-staff ratios or caregiver education requirements. Process quality refers to the richness of interactions between children and caregivers, or children and their peers, and of the learning experiences and instruction. Source: Slot, P. (2011). Structural characteristics and process quality in early childhood education and care: A literature review (OECD Education Working Paper No. 176). Organisation for Economic Co-operation and Development. http://www.oecd.org/officialdocuments/publicdisplaydocumentpdf/?cote=EDU/WKP(2018)12&docLanguage=En
  2. State counts include the District of Columbia.
  3. The Child Care and Development Fund is governed by the Child Care Development Block Grant.

A key component of how QRIS can support families during the prenatal-to-3 period is providing information on child care quality. The idea behind QRIS is that “child-care quality is difficult to ascertain. Creating an assessment system that produces a single, easy-to-understand rating for each provider allows parents, providers, funders, and other stakeholders to more easily determine a provider’s quality” (p. 7).15 By establishing a QRIS, identifying indicators of quality, and assessing and rating ECE providers, a variety of audiences can make informed decisions regarding ECE providers.

Upon learning their ratings, ECE providers will have additional information about the quality of their programs and this information may help incentivize providers to improve their quality (i.e., if providers lacked information and do not want to be poorly rated).A In addition, financial incentives and technical assistance available in QRIS may help and push providers to establish higher-quality care according to QRIS ratings.15 If ratings drive parental choices on child care, more providers are expected to participate in QRIS to attract families seeking high-quality care; consequently, lower-quality providers may either go out of business or improve their quality to attract families. This process is expected to produce a larger pool of quality child care, improving the care that children receive and ultimately leading to improved child wellbeing.15,A,16

The link between QRIS and actual quality, however, depends on many factors. If QRIS are unable to differentiate well between levels of quality,iv it may be difficult to detect differences in child outcomes among children served in ECE programs rated at different quality levels. Additionally, QRIS may include components that are useful to the state in assessing quality practices but may not have an evidence base for improving child outcomes. Including these components in the QRIS may make it difficult to see differences in child outcomes by rating levels.4,17,18 To the extent that factors beyond a lack of clear information on quality drive family decision making around child care, child outcomes may not improve if families are unable to act on information provided by QRIS (e.g., due to cost barriers or inadequate supply of providers). Finally, some research suggests that current and widely used measures of quality, particularly measures of overall quality, are linked to small or null associations with child outcomes; if these quality measures are used within QRIS or to assess their validity, it may be difficult to see gains in children’s outcomes.19

Decades of research in the field of child development have made clear the conditions necessary for young children and their families to thrive.20 These conditions are represented by our eight policy goals, shown in Table 1. The goals with which QRIS are theoretically aligned are indicated below.

Table 1: Policy Goals Theoretically Aligned With QRIS

AlignedPolicy Goal
Access to Needed Services
Parents’ Ability to Work
Sufficient Household Resources
Healthy and Equitable Births
Parental Health and Emotional Wellbeing
Nurturing and Responsive Child-Parent Relationships
Nurturing and Responsive Child Care in Safe Settings
Optimal Child Health and Development

  1. For example, due to small differences in actual quality between QRIS rating levels or flexibility in how providers can attain high rating levels (such as through accreditation).

The QRIS evidence base is limited; studies are often observational and lack strong causal designs, many studies were conducted in the early stages of QRIS implementation, and studies frequently focus on children ages 3 to 5, excluding those ages 0 to 3. Although the following review focuses on the limited causal evidence for QRIS, examples of important observational studies are discussed when relevant, particularly if they suggest critical directions for future research.

The research discussed here meets our standards of evidence for being methodologically strong and allowing for causal inference, unless otherwise noted. Each strong causal study reviewed has been assigned a letter, and a complete list of causal studies can be found at the end of this review, along with more details about our standards of evidence and review method. The findings from each strong causal study reviewed align with one of our eight policy goals from Table 1. The Evidence of Effectiveness table below displays the findings associated with QRIS (beneficial, null,v or detrimental) for the strong study (A) in the causal studies reference list. Findings for study B, which meets the criteria to be considered methodologically strong, are excluded from the table because the findings cannot be clearly classified as beneficial or detrimental to prenatal-to-3 wellbeing, but nevertheless warrant discussion. The assessment of the overall impact for each studied policy goal weighs the timing of publication and relative strength of each study, as well as the size and direction of all measured indicators.

Table 2: Evidence of Effectiveness for QRIS by Policy Goal

Policy GoalIndicatorBeneficial ImpactsNull ImpactsDetrimental ImpactsOverall Impact on Goal
Access to Needed ServicesReduced Enrollment in Low-Quality Child CareATrending^ Positive
Nurturing and Responsive Child Care in Safe SettingsChild Care Quality ImprovementATrending Positive

^Trending indicates that the evidence is from fewer than two strong causal studies or multiple studies that include only one location, author, or data set.


Access to Needed Services

Both of the strong causal studies included in this review examined the impact of QRIS on the types of providers parents selected to provide care for their children. A longitudinal study of licensed center-based providers rated in North Carolina’s QRIS between 2007 and 2009 found that providers with lower initial QRIS ratings had lower student enrollment at later time periods, and these effects were concentrated among programs in areas of high competition.A,vi Providers with lower initial ratings had approximately five and eight fewer students at three and five years post-initial rating (effect size at five years post-rating was 0.18) and that at five years post-rating, programs with lower initial ratings had approximately an 8 percentage point reduction in their capacity utilization (the percent of total student capacity being used). The authors hypothesized that the lag in parents’ response may have been due to parents’ lack of desire to transfer children currently enrolled in a care setting and there may have been a lag in the provision of this type of information to parents. Regardless, this evidence is consistent with the idea that parents respond to low QRIS ratings by moving their children out of the care of these providers.

A second longitudinal study on the effect of QRIS enactment on parent choice of child care providers found that the implementation of QRIS led to a shift from parental to nonparental care.B However, different types of families responded differently: economically disadvantagedvii families were more likely to use relative care as compared to parental care; economically advantaged families were more likely to use nonrelative, informal care as compared to parental care. Neither the full sample or either sub-sample of families was more likely to select formal child care providers (home- or center- based child care) relative to parental care. This study also found that, in the full sample of families, QRIS enactment led to approximately two more hours per week of nonparental child care use. QRIS enactment was also linked to lower likelihood of paying for care in the disadvantaged subsample; the opposite was true in the advantaged sample. Impacts of QRIS enactment differ across subgroups and child care types, but overall evidence suggests that QRIS may lead to increased use of nonparental care.

Although both of these studies included ECE programs serving children from birth through age 5, neither study disaggregated findings by age of children served to identify impacts specific to the care of infants and toddlers. No other strong causal studies have examined the impact of QRIS enactment or rating levels on the choices that parents make for the care of their infant and toddler children.

Parents’ Ability to Work

The longitudinal study of the impact of QRIS implementation also examined indicators related to maternal employment.B In this study, the author hypothesized that QRIS enactment would increase the demand for higher-quality care, formal care, and providers who participate in the state QRIS; these changes would subsequently result in higher family expenditures, driving “down-stream” changes in maternal employment, in response to increased expenditures. The findings demonstrate that QRIS enactment can lead to an increased likelihood of maternal work and increases in mothers’ amount of work (weekly hours, annual weeks of work) and earnings. However, these impacts were concentrated among the sub-sample of advantaged mothers only. These findings do suggest that there may be far-reaching consequences of QRIS; future research should explore this more thoroughly, especially among parents of infants and toddlers and to better understand if these impacts are beneficial for families.

Nurturing and Responsive Child Care in Safe Settings

Very limited causal evidence exists that examines the link between QRIS and quality improvement of child care providers over time. One study of North Carolina’s QRIS found that lower initial ratings of center-based providers led to improvements in ratings over time – in the first two years after the initial rating, there was a statistically significant gap in the probability of achieving at least a four-star rating between providers rated lower and higher at the initial time point.A However, by three years after the initial rating, this gap had closed, suggesting lower-rated providers had increased their ratings. Although not statistically significant, the trend for the probability of a achieving a three-star rating or higher was similar. Additionally, this study found that lower initial ratings led to increases in future measures of observed qualityviii by 0.25 and 0.21 points at four and five years post-initial rating, respectively, aligning with when programs were expected to be re-rated. The latter is equivalent to a “0.36 effect size with respect to the standard deviation observed at baseline,” meaning that “the estimated effect of receiving a three-star rating instead of a four-star rating is over 1.2 program-level standard deviations” (pp. 855-856). The authors also assessed the impact of lower quality ratings on changes in other measures of quality (e.g., staff qualifications and experience, ratios, or physical space requirements), but found null results.

Although causal evidence on the impact of QRIS on child care quality and quality improvement is limited, a large number of observational studies have been conducted at the state level on the validation of QRIS. Whether or not these systems are valid, defined as “how well the quality measurement and rating process are working to differentiate meaningful levels of ECE program quality in a QRIS” (p. 3),18,21 is critical to understanding the effectiveness of QRIS. Validity is typically assessed through validation studies and, if designed rigorously, state QRIS validation studies can help us better understand if QRIS ratings are linked to actual quality measures and what the critical components of these complex systems may be. Unfortunately, many validation studies were conducted early in the history of QRIS (e.g., concurrent with implementation or in newly implemented systems) and suffered from methodological and design issues, such as difficulty recruiting providers, nonexperimental study designs,ix and small samples.17,18,22 Relevant to this review, many validation studies also focused on the preschool population, rather than on infants and toddlers. Two recent syntheses of validation studies can help provide some insight into the association between QRIS and quality, but these results should not be interpreted as causal due to design concerns with individual state validation studies.

A synthesis of nine QRIS validation studies conducted between 2013 and 2017 found positive associations between QRIS ratings and at least one measure of observed quality, although most states found mixed results.18 Among the four state studies examining infant and toddler classrooms, results were also mixed, although three states found at least one positive association between QRIS ratings and a measure of observed quality. A synthesis of Race to the Top-Early Learning Challenge (RTT-ELC) state validation studies found that “higher-rated programs scored higher on independent assessments of program quality than lower-rated programs” (p. 17).17 These findings were similar to those of the earlier synthesis: both reports concluded that overall ECE program quality was not high; that QRIS distinguish between high- and low-quality programs, but not consistently between individual rating levels; and that differences between high- and low-rated programs were small.17,18 These syntheses included some of the same state validation studies, so consistency in results is to be expected.

One longitudinal study examined the impact of QRIS implementation on the supply of child care labor.B This study found that QRIS implementation increased new hires (by approximately 4 percent for the full sample), but also increased job separations (by 2 to 3 percent per quarter); these effects essentially negate each other. The study also found that QRIS enactment led to small increases in monthly earnings for child care workers (0.7 percent) and new hires (0.8 percent). The size of these labor force and earnings effects were relatively consistent in subanalyses by worker educational attainment and age, but tended to be somewhat larger for less-skilled and younger workers. Although it is unclear from these analyses if these results are beneficial, to the extent that wellbeing is improved within the child care workforce, children may benefit if this leads to better caregiver-child interactions. Future research should address these issues to better understand the impact of QRIS on the child care workforce.


  1. An impact is considered statistically significant if p<0.05.
  2. Competition was defined by the authors as the number of other ECE programs within 5 miles of a program at the initial observation year; high competition was defined as competition above the median level. For more information, see study A (Bassok, Dee, and Latham, 2019).
  3. The author defines economically disadvantaged families as those in which the mother has a high school degree or less; economically advantaged families are defined as families in which the mother has more than a high school degree. For more information, see study B (Herbst, 2018).
  4. Observed quality was measured by the Environment Rating Scale scores (e.g., ITERS, ECERS).
  5. Many state validation studies included limited covariates as controls in statistical models and very few states controlled for baseline equivalence of groups.

Neither of the strong causal studies included in this review directly assessed if QRIS reduces disparities. The longitudinal study examining impacts of QRIS enactment on child care choices and maternal employment did suggest that disadvantaged and advantaged families are impacted differentially by QRIS enactment (e.g., in type of child care selected, maternal employment indicators).B However, this study did not directly assess reducing disparities. To date, no strong causal evidence has examined the effect of QRIS across different racial and ethnic groups, or the potential impact of QRIS on racial and ethnic disparities in access to quality child care.


  1. Disparities are defined here as differential outcomes by race, ethnicity, or socioeconomic status (SES).

No studies examined for this review studied the return on investment for QRIS. A more comprehensive analysis of the return on investment is forthcoming.

To date, the impacts of QRIS on outcomes in the prenatal-to-3 period are limited. The theory of change for QRIS suggests that QRIS may affect family choices regarding the quality of providers their children are enrolled in, lead to quality improvement among lower-rated providers, and improve child health and developmental outcomes due to an increased number of children in higher-quality care over time. However, the existing evidence base of causal research is not able to provide evidence of these impacts or guidance to states on QRIS as an effective strategy to improve outcomes in the prenatal-to-3 period.

The body of research on QRIS has grown in recent years, but gaps remain. One study included in this review found evidence of the causal impact of low initial QRIS ratings on both child enrollment in low-quality providers and quality improvements over time.A These findings are positive, but more research is needed on how QRIS ratings affect parental choices of care and the quality levels among ECE providers. Observational evidence from state validation studies provides support for the ability of QRIS ratings to distinguish between high- and low-quality ECE programs, but this observational evidence does not suggest that QRIS may accurately differentiate quality between individual rating levels.17,18

Additionally, future research is needed on the specific elements within QRIS that are linked to quality and improving child outcomes, especially for children ages 0 to 3. It is also critical to understand measurement within QRIS—including use of valid measures of quality (both broad and specific), identification of clear cut-points and thresholds useful for identifying different levels of quality, and understanding which components should be included in QRIS that have evidence of links to quality and improved child outcomes. Without this knowledge, it will be difficult to pinpoint the best ways to improve ECE quality and child outcomes within a complex system.

Longitudinal studies are also needed to assess impacts of QRIS over time as these systems evolve (e.g., on parental choice, quality ratings, and child outcomes). Additionally, future studies should incorporate home-based providers, who are often left out of QRIS studies but frequently serve infants and toddlers.

No studies meeting our standards of evidence for establishing causality examined indicators of optimal child health and development. However, the two reports synthesizing observational state validation studies generally found that higher QRIS ratings were not associated with beneficial changes in children’s wellbeing.xi One report found limited, inconsistent evidence of small, positive associations between QRIS ratings and some measures of child wellbeing; however, these findings were not consistent in all states, “across all developmental domains examined, nor across all measures within a domain” (p. 52), and, in many cases, null effects were found.18 Similarly, the report on RTT-ELC state validation studies found that, with few exceptions, states did not see children in higher-rated programs have better outcomes than children in lower-rated programs.17 In both cases, state validation studies typically focused on children ages 3 to 5, not infants and toddlers, and these results may not be generalizable to younger children. Future research is needed that includes infants and toddlers, examines disparities between groups of children, and seeks to better understand the size of quality impacts from QRIS needed among ECE providers to lead to improvements in children’s wellbeing.


  1. Child wellbeing is typically measured by outcomes on early language and literacy, math skills, cognitive skills, social-emotional development, and physical development. The state validation reports included a range of measures to observe these components of wellbeing, including but not limited to: (a) language and literacy (Peabody Picture Vocabulary Test, Woodcock Johnson-III [WJ-III] Letter-Word); math skills (WJ-III Applied Problems); cognitive skills (Bracken; Head, Toes, Knees, and Shoulders; peg tapping); social-emotional development (Preschool Learning Behaviors Scaled, the Devereux Early Childhood Assessment); and physical development (body mass index, Mullen Fine and Gross Motor).

Child care quality rating and improvement systems (QRIS) need further study before conclusions can be made about their impact on outcomes during the prenatal-to-3 period. Limited causal evidence suggests that low initial QRIS ratings may decrease child enrollment in lower-quality child care providers and lead to quality improvement among child care providers.A However, rigorous evidence does not yet exist that suggests QRIS ratings influence parental decision-making regarding child care, or that QRIS are linked to quality, can differentiate levels of quality among child care providers, or that children enrolled in the care of providers rated more highly on QRIS see improved child outcomes over those in lower-quality programs. Although 45 states have either fully-implemented statewide or locally administered QRIS or are currently piloting QRIS,6,7 many of these systems are relatively new and more research is needed to assess the impact of these systems on the prenatal-to-3 period and provide policy guidance to states on QRIS. In particular, future causal research specific to infants and toddlers and research to identify critical elements of QRIS is needed.

As of fall 2019, 40 states have statewide QRIS and two states have QRIS that are administered locally; an additional three states are currently in the pilot phase of their QRIS.6,7,xii Among the six states that do not have a QRIS fully implemented or in the pilot phase, two states are in the planning/development stage and one state is developing an alternative system. For more information on QRIS variation and components by state, see Tables 3a and 3b below.

Some state QRIS are entirely voluntary, and programs must opt into the system. Other states mandate participation as a component of licensing. Many states fall somewhere in between—participation is voluntary for most ECE programs but mandatory for providers based on funding streams (e.g., providers accepting children with subsidies, Head Start or school-based providers receiving public funding). Most QRIS include a range of types of providers: all QRIS include center-based providers, and most include home-based, Head Start, and school-based programs as well.6 Participation rates vary by state, ranging from less than 5 percent of eligible providers in some states to 100 percent of eligible providers in states with mandatory participation.B,6

States also vary in how the QRIS scoring systems functionxiii and the number of rating levels in the system.4,5 In 2019, almost all state QRIS included indicators related to staff qualifications and training, as well as to the classroom environmentxiv of the ECE programs.6 Also common were indicators related to program administration, management, and leadership; curriculum; family partnerships and engagement; and interactions between staff and children. Less common were indicators related to accreditation or staff compensation and benefits.6 The financial incentives in QRIS also vary. Most common are quality awards or bonuses,6 but states may also offer quality improvement grants, bonuses, and awards; staff awards (wage and retention awards, scholarships to pursue higher education in an ECE-related field); tiered subsidy reimbursement rates or tiered bonuses; and tax credits, among others.23,24


  1. Where necessary, information was also checked by examining state QRIS websites. Alaska is currently in the process of implementing its statewide QRIS. Only 2 out of 5 levels have been implemented. The classification as “pilot” matches the state’s own description in its CCDF plan. Arizona implemented their QRIS starting in 2011, however they are currently carrying out an additional pilot which will is scheduled for completion in 2020. A QRIS can be administered through various entities. California’s QRIS are administered by 42 QRIS consortia across the state. In Florida, the Office of Early Learning offers statewide quality improvement system (http://www.floridaearlylearning.com/statewide-initiatives/early-learning-performance-funding-project), but local counties administer specific rating programs. Connecticut began the pilot of its QRIS in 2017 and expects full implementation of the ratings system in 2021. Mississippi no longer has a QRIS. Rather, the state is in the process of implementing an alternative quality system with two designations: (1) Standard = “Meets basic quality standards for health, safety, nutrition, care, and learning,” and (2) Comprehensive = “Cultivating partnerships and facilitating continuity of care and learning for children ages 0-8.” Additional information in the state CCDF plan.
  2. States tend to fall into one of three rating categories: (a) building blocks, where programs must meet all criteria before moving to the next level; (b) points, where states earn points for components, and ratings are determined by a range of points; or (c) a hybrid system that combines the two. For more information see Tout et al. (2010).
  3. State QRIS typically assess classroom environment through observational tools such as the Environment Rating Scales (ERS) and the Classroom Assessment Scoring System (CLASS). The scales typically include measures of the climate, teacher behavior and teacher-child interactions, and support for learning.


Table 3a: State Variation in QRIS

Variation
StateState QRIS Detail% of Providers Participating in State's QRISQRIS Includes a Salary Scale and/or Benefits for Center-Based CareQRIS Includes a Salary Scale and/or Benefits for Family Child Care
AlabamaStatewide QRISNRNRNR
AlaskaPilot34.4%YesNo
ArizonaStatewide QRIS26.7%NoNo
ArkansasStatewide QRIS61.1%YesNo
CaliforniaNon-statewide QRIS11.7%NoNo
ColoradoStatewide QRIS100.0%NoNo
ConnecticutPilotNRNRNR
DelawareStatewide QRIS42.1%YesNo
District of ColumbiaStatewide QRIS48.4%NoNo
FloridaNon-statewide QRISNRNoNo
GeorgiaStatewide QRIS41.7%NoNo
HawaiiNoneNo QRISNo QRISNo QRIS
IdahoStatewide QRIS12.9%NoNo
IllinoisStatewide QRIS100.0%NoNo
IndianaStatewide QRIS74.9%NoNo
IowaStatewide QRIS32.3%NoNo
KansasPilotNRNRNR
KentuckyStatewide QRIS58.5%NoNo
LouisianaStatewide QRISNRNoNo
MaineStatewide QRIS56.6%NoNo
MarylandStatewide QRIS49.6%YesNo
MassachusettsStatewide QRIS51.6%NoNo
MichiganStatewide QRIS51.8%YesNo
MinnesotaStatewide QRIS19.4%NoNo
MississippiNoneNo QRISNo QRISNo QRIS
MissouriNoneNo QRISNo QRISNo QRIS
MontanaStatewide QRIS26.8%NoNo
NebraskaStatewide QRISNRNoNo
NevadaStatewide QRISNRYesNo
New HampshireStatewide QRIS100.0%YesNo
New JerseyStatewide QRIS2.4%YesNo
New MexicoStatewide QRIS100.0%NoNo
New YorkStatewide QRIS1.5%YesNo
North CarolinaStatewide QRIS100.0%YesNo
North DakotaStatewide QRIS12.2%NoNo
OhioStatewide QRIS66.9%YesNo
OklahomaStatewide QRIS100.0%NoNo
OregonStatewide QRIS100.0%NoNo
PennsylvaniaStatewide QRIS100.0%YesNo
Rhode IslandStatewide QRIS81.7%NoNo
South CarolinaStatewide QRIS42.0%NoNo
South DakotaPlanningNRNRNR
TennesseeStatewide QRIS100.0%YesNo
TexasStatewide QRIS11.1%NoNo
UtahStatewide QRIS34.3%NoNo
VermontStatewide QRIS100.0%YesNo
VirginiaStatewide QRIS23.8%NoNo
WashingtonStatewide QRIS42.8%NoNo
West VirginiaPlanningNRNRNR
WisconsinStatewide QRIS77.8%YesNo
WyomingNoneNo QRISNo QRISNo QRIS
Best StateN/A100%N/AN/A
Worst StateN/A1.50%N/AN/A
Median StateN/A50.60%N/AN/A
State Count40 (Statewide QRIS)N/A150

Data as of December 31, 2019. The Build Initiative & Child Trends’ Quality Compendium data system.
“NR” indicates that the state did not report these data about its QRIS in the 2019 QRIS Compendium.
For additional source and calculation information, please go to Methods and Sources.


Table 3b: State Variation in QRIS

Variation
StateQRIS Includes Ratio StandardsQRIS Includes Coaching as Technical AssistanceQRIS Includes Standards for Teacher Qualifications for Center-Based CareQRIS Includes Standards for Teacher Qualifications for Family Child Care
AlabamaNRNRNRNR
AlaskaNoYesYesYes
ArizonaYesYesNoYes
ArkansasNoYesYesYes
CaliforniaYesYesYesYes
ColoradoYesYesYesYes
ConnecticutNRNRNRNR
DelawareYesYesYesYes
District of ColumbiaNoYesNoNo
FloridaNoYesYesYes
GeorgiaYesYesYesYes
HawaiiNo QRISNo QRISNo QRISNo QRIS
IdahoYesYesYesYes
IllinoisYesYesYesYes
IndianaYesYesYesYes
IowaYesYesYesYes
KansasNRNRNRNR
KentuckyYesYesYesYes
LouisianaNoYesNoNo
MaineYesYesYesNo
MarylandYesYesYesYes
MassachusettsYesYesYesYes
MichiganYesYesYesYes
MinnesotaNoYesYesYes
MississippiNo QRISNo QRISNo QRISNo QRIS
MissouriNo QRISNo QRISNo QRISNo QRIS
MontanaYesYesYesYes
NebraskaYesYesYesYes
NevadaYesYesYesYes
New HampshireYesYesYesYes
New JerseyYesYesYesYes
New MexicoYesYesYesYes
New YorkNoYesYesYes
North CarolinaYesYesYesYes
North DakotaYesYesYesYes
OhioYesYesYesYes
OklahomaNoYesYesYes
OregonYesYesYesYes
PennsylvaniaNoYesYesYes
Rhode IslandYesYesYesYes
South CarolinaYesYesYesYes
South DakotaNRNRNRNR
TennesseeYesYesYesYes
TexasYesYesYesYes
UtahYesNoYesNo
VermontNoYesYesYes
VirginiaNoYesYesYes
WashingtonNoYesYesYes
West VirginiaNRNRNRNR
WisconsinNoYesYesYes
WyomingNo QRISNo QRISNo QRISNo QRIS
State Count29413938

Data as of December 31, 2019. The Build Initiative & Child Trends’ Quality Compendium data system.
“NR” indicates that the state did not report these data about its QRIS in the 2019 QRIS Compendium.
For additional source and calculation information, please go to Methods and Sources.

Method of Review

This evidence review began with a broad search of all literature related to the policy and its impacts on child and family wellbeing during the prenatal-to-3 period. First, we identified and collected relevant peer-reviewed academic studies as well as research briefs, government reports, and working papers, using predefined search parameters, keywords, and trusted search engines. From this large body of work, we then singled out for more careful review those studies that endeavored to identify causal links between the policy and our outcomes of interest, taking into consideration characteristics such as the research designs put in place, the analytic methods used, and the relevance of the populations and outcomes studied. We then subjected this literature to an in-depth critique and chose only the most methodologically rigorous research to inform our conclusions about policy effectiveness. All studies considered to date for this review were released on or before March 31, 2020.

Standards of Strong Causal Evidence

When conducting a policy review, we consider only the strongest studies to be part of the evidence base for accurately assessing policy effectiveness. A strong study has a sufficiently large, representative sample, has been subjected to methodologically rigorous analyses, and has a well-executed research design allowing for causal inference – in other words, it demonstrates that changes in the outcome of interest were likely caused by the policy being studied.

The study design considered most reliable for establishing causality is a randomized control trial (RCT), an approach in which an intervention is applied to a randomly assigned subset of people. This approach is rare in policy evaluation because policies typically affect entire populations; application of a policy only to a subset of people is ethically and logistically prohibitive under most circumstances. However, when available, randomized control trials are an integral part of a policy’s evidence base and an invaluable resource for understanding policy effectiveness. Rigorous meta-analyses with sufficient numbers of studies, when available, also inform our conclusions.

The strongest designs typically used for studying policy impacts are quasi-experimental designs (QEDs) and longitudinal studies with adequate controls for internal validity (for example, using statistical methods to ensure that the policy, rather than some other variable, is the most likely cause of any changes in the outcomes of interest). Our conclusions are informed largely by these types of studies, which employ sophisticated techniques to identify causal relationships between policies and outcomes. Rigorous meta-analyses with sufficient numbers of studies, when available, also inform our conclusions.

Studies That Meet Standards of Strong Causal Evidence

  1. Bassok, D., Dee, T. S., & Latham, S. (2019). The effects of accountability incentives in early childhood education. Journal of Policy Analysis and Management, 38(4), 838–866. https://doi.org/10.1002/pam.22149
  2. Herbst, C. M. (2018). The impact of quality rating and improvement systems on families’ child care choices and the supply of child care labor. Labour Economics, 54, 172–190. https://doi.org/10.1016/j.labeco.2018.08.007

 Other References

  1. Yoshikawa, H., Weiland, C., Brooks-Gunn, J., Burchinal, M. R., Espinosa, L. M., Gormley, W. T., Ludwig, J., Magnuson, K.A., Phillips, D. & Zaslow, M. J. (2013). Investing in our future: The evidence base on preschool education. Society for Research in Child Development, Foundation for Child Development. https://eric.ed.gov/?id=ED579818
  2. Mitchell, A. (2005). Stair steps to quality. A guide for states and communities developing quality rating systems for early care and education. United Way Success by 6. http://www.earlychildhoodfinance.org/downloads/2005/MitchStairSteps_2005.pdf.
  3. Zaslow, M. & Tout, K. (2014). Reviewing and clarifying goals, outcomes and levels of implementation: Toward the next generation of quality rating and improvement systems (QRIS) (OPRE Research Brief #2014-75). Office of Planning, Research and Evaluation, Administration for Children and Families, US Department of Health and Human Services. https://www.acf.hhs.gov/opre/resource/reviewing-and-clarifying-goals-outcomes-and-levels-of-implementation-toward-the-next-generation-of-quality-rating-and
  4. Kirby, G., Caronongan, P., Mraz Esposito, A., Murphy, L., Shoji, M., Del Grosso, P., Kiambuthi, W., Clark, M. & Dragoset, L. (2017). Progress and challenges in developing tiered quality rating and improvement systems (TQRIS) in the round 1 Race to the Top-Early Learning Challenge (RTT-ELC) States(NCEE 2018-4003). National Center for Education Evaluation and Regional Assistance, Institute of Education Sciences, US Department of Education. https://ies.ed.gov/ncee/pubs/20184003/
  5. Tout, K., Starr, R., Soli, M., Moodie, S., Kirby, G., & Boller, K. (2010). The child care quality rating system (QRS) assessment: Compendium of quality rating systems and evaluations. Office of Planning, Research & Evaluation, Administration for Children and Families, US Department of Health and Human Services. https://www.acf.hhs.gov/opre/resource/compendium-of-quality-rating-systems-and-evaluations
  6. The Build Initiative & Child Trends. (2019). A catalog and comparison of quality initiatives [Data System]. Retrieved from http://qualitycompendium.org/ on February 26, 2020. Data as of December 31, 2019. Information may be pulled from the data file or the sections of the website (top trends, state profiles).
  7. Office of Child Care, Administration for Children and Families. (2016, June 16). Approved CCDF plans (FY 2019-2021). Office of Child Care | ACF. https://www.acf.hhs.gov/occ/resource/state-plans. CCDF plans effective October 1, 2018. See section 7.4.1.
  8. Yazejian, N., & Iruka, I. U. (2015). Associations among tiered quality rating and improvement system supports and quality improvement. Early Childhood Research Quarterly, 30, 255–265. https://doi.org/10.1016/j.ecresq.2014.05.005
  9. Office of Child Care, Administration for Children and Families. (2018). Preschool Development Grant Birth through Five (PDG B-5). https://ami.grantsolutions.gov/HHS-2018-ACF-OCC-TP-1379
  10. Office of Child Care, Administration for Children and Families. (n.d.). Preschool Development Grant Birth through Five (PDG B-5) Renewal Grant. https://ami.grantsolutions.gov/files/HHS-2019-ACF-OCC-TP-1567_0.htm
  11. Office of Child Care, Administration for Children and Families. (2016). Child Care and Development Fund Final Rule Frequently Asked Questions. Office of Child Care | ACF. https://www.acf.hhs.gov/occ/resource/ccdf-final-rule-faq
  12. National Center on Early Childhood Quality Assurance. (n.d.). QRIS resource guide. Cost projections and financing. https://ecquality.acf.hhs.gov/resource-guide/cost-projections-and-financing
  13. National Center on Early Childhood Quality Assurance. (2016). QRIS compendium: 2016 fact sheets. Funding and financial incentives. National Center on Early Childhood Quality Assurance. https://childcareta.acf.hhs.gov/resource/qris-compendium-fact-sheet-funding-and-financial-incentives.
  14. BUILD Initiative, Center for American Progress, Children’s Funding Project, Institute on Taxation and Economic Policy, and University of Maryland College Park, Schools of Public Health and Public Policy (2019). Funding our future: Generating state and local tax revenue for quality early care and education. The BUILD Initiative. https://www.buildinitiative.org/Resources/Funding-our-Future
  15. Zellman, G. L., & Perlman, M. (2008). Child-care Quality Rating and Improvement Systems in five pioneer states: Implementation issues and lessons learned. RAND. https://www.rand.org/pubs/monographs/MG795.html
  16. Schilder, D., Iruka, I. U., Dichter, H., & Mathias, D. (2015). Quality rating and improvement systems: Stakeholder theories of change and models of practices. The BUILD Initiative. https://www.buildinitiative.org/QRIS30ToolsandResources
  17. Fox, L., McCullough, M., Caronongan, P., & Herrman, M. (2019). Are ratings from tiered quality rating and improvement systems valid measures of program quality? A synthesis of validation studies from Race to the Top—Early Learning Challenge states. National Center for Education Evaluation and Regional Assistance, Institute of Education Sciences, US Department of Education. https://www.mathematica.org/our-publications-and-findings/publications/are-ratings-from-tiered-quality-rating-and-improvement-systems-valid-measures-of-program-quality
  18. Tout, K., Magnuson, K., Lipscomb, S., Karoly, L., Starr, R., Quick, H., Early, D., Epstein, D., Joseph, G., Maxwell, K., Roberts, J., Swanson, C., & Wenner, J. (2017). Validation of the quality ratings used in quality rating and improvement systems (QRIS): A synthesis of state studies (OPRE Report #2017-92). Office of Planning, Research & Evaluation, Administration for Children and Families, US Department of Health and Human Services. https://www.acf.hhs.gov/opre/resource/validation-quality-ratings-used-quality-rating-improvement-systems-qris-a-synthesis-of-state-studies
  19. Burchinal, M., Zaslow, M., & Tarullo, L. (Eds.). (2016). Quality thresholds, features, and dosage in early care and education: Secondary data analyses of child outcomes. Monographs of the Society for Research in Child Development, 81(2), 1–128. https://doi.org/10.1111/mono.12248
  20. Shonkoff, J., & Phillips, D. (2000). From neurons to neighborhoods: The science of early childhood development. The National Academies Press. https://doi.org/10.17226/9824.
  21. Zellman, G. L., & Fiene, R. (2012). Validation of quality rating and improvement systems for early care and education and school-age care (OPRE 2012-29). Office of Planning, Research & Evaluation, Administration for Children & Families, US Department of Health and Human Services. https://www.acf.hhs.gov/opre/resource/validation-of-quality-rating-and-improvement-systems-for-early-care-and
  22. Markowitz, A. J., Bassok, D., & Player, D. (2020). Simplifying quality rating systems in early childhood education. Children and Youth Services Review, 112, 104947. https://doi.org/10.1016/j.childyouth.2020.104947
  23. National Center on Early Childhood Quality Assurance. (n.d.). Provider incentives and support. https://ecquality.acf.hhs.gov/resource-guide/provider-incentives-and-support
  24. National Center on Early Childhood Quality Assurance. (2017). Financial incentives in QRIS. National Center on Early Childhood Quality Assurance. https://qrisguide.acf.hhs.gov/sites/default/files/QRIS_Financial_Incentives.pdf

Child Care Quality Rating and Improvement Systems (PDF)

Recommended Citation
Prenatal-to-3 Policy Impact Center. (2020). Prenatal-to-3 policy clearinghouse evidence review: Child care quality rating and improvement systems (ER 0920.016A). Child and Family Research Partnership. Lyndon B. Johnson School of Public Affairs, University of Texas at Austin. http://pn3policy.org/policy-clearinghouse/child-care-quality-rating-and-improvement-systems