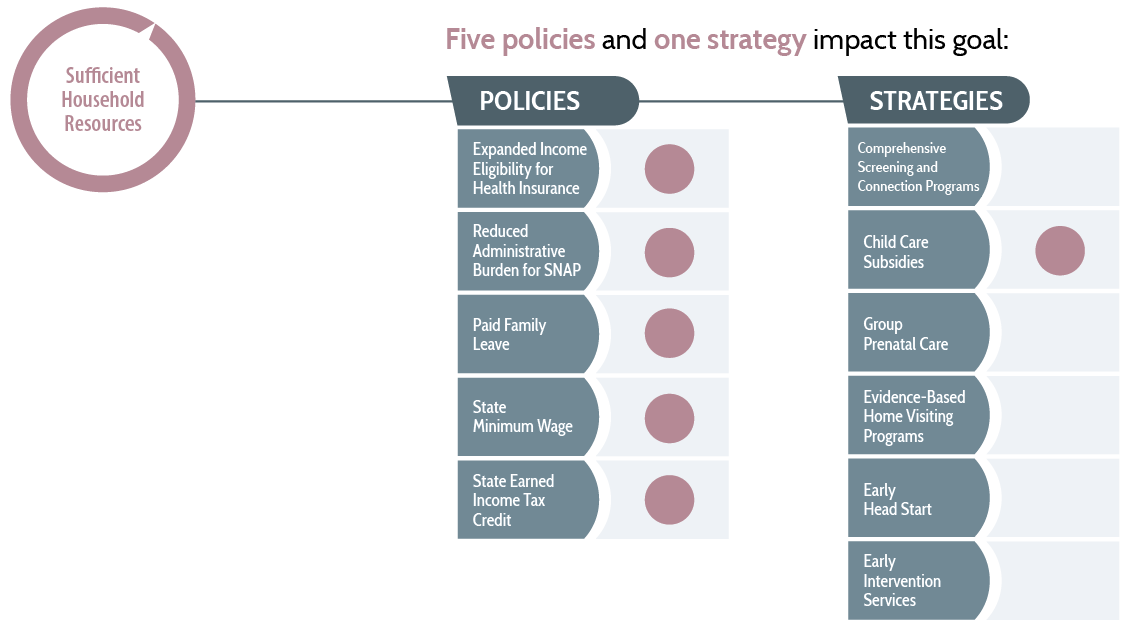
Effective policies and strategies to impact this goal include:
Parents have the financial and material resources they need to provide for their families.

WHY IS SUFFICIENT HOUSEHOLD RESOURCES AN IMPORTANT PRENATAL-TO-3 GOAL?
Experiences of financial hardship during early childhood can disrupt healthy brain development and compromise the foundation for long-term learning, behavior, and health.1 Approximately 1 in 5 young children in the US, or roughly 18.3% of children under age 3, live in families with annual household incomes of less than 100% of the federal poverty level (FPL), or $27,750 per year for a family of four.2,3 These families face great difficulties just with meeting basic needs and are likely to face challenges related to adequate shelter, nutrition, and medical care.4 They also are more likely to experience stress, which can compromise parents’ ability to engage in the warm, responsive interactions that are critical to infants’ and toddlers’ healthy development.5,6
The poverty rate varies considerably by race and ethnicity, and children of color are disproportionately likely to face challenges related to financial hardship.7 Job losses stemming from the COVID-19 crisis have deepened economic instability while also perpetuating racial disparities.8 Financial hardship is a major predictor of food insecurity, which can lead to malnutrition and have negative impacts on children’s health.9,10,11 Moreover, families with low incomes are more likely to live in crowded housing, which increases the risk of housing instability or homelessness and is often associated with chaotic environments that do not promote healthy child development.12
An August 2021 survey conducted by the US Census Bureau and analyzed by the Center on Budget and Policy Priorities, found that 11% of households with children reported that they lacked sufficient food in the past week, compared to 7% of households with no children.13 Hardship varied by race and ethnicity; 15% of Black households (with or without children) reported food insecurity in the past week, compared to 13% of Latino households, 6% of White households, and 4% of Asian households. In addition to food insecurity, families have struggled with access to affordable housing in the past year. The survey found that 22% of households with children reported being behind on rent, compared to 10% of households with no children. Overall, 41% of Black households (with or without children) reported having difficulty paying for household expenses in the past week, compared to 37% of Latino households, 22% of White households, and 22% of Asian households.
To limit young children’s exposure to these stressors, which can have serious and long-lasting consequences for health and wellbeing, states can pursue policies and strategies to ensure that parents have adequate financial and material resources. According to our comprehensive reviews of rigorous research, several solutions currently in place at the state level—including earned income tax credits and minimum wage policies—have proven effective at increasing household resources. We provide an overview of these and other solutions, as well as the outcomes states should track to measure their progress toward achieving this goal.
HOW ARE STATES CURRENTLY MEETING THIS PRENATAL-TO-3 GOAL?
Three outcome measures illustrate whether families with young children have sufficient household resources: (1) child poverty, (2) crowded housing, and (3) food insecurity. These outcomes vary considerably across states, as well as by race and ethnicity.
All three outcome measures were calculated intentionally in the negative direction to demonstrate where states have room for improvement and to help states prioritize the prenatal-to-3 policy goals. Out of 51 states, the state lagging furthest behind ranks 51st, and the leading state ranks first. The median state indicates that half of states have outcomes that measure better than that state, whereas half of states have outcomes that are worse. Importantly, the “leading” state on a given outcome does not necessarily indicate a target for all other states to strive toward; even in the states with the best outcomes, many children and families are struggling.
OUTCOME MEASURE: CHILD POVERTY
% children under age 3 in poverty
Median state value: 17.6%
Nearly 1 out of 5 US children under age 3 lives in poverty, which can lead to a host of negative health and developmental outcomes in the immediate and long term. Infants and toddlers who live in the five lagging states on this indicator are 3 to 4 times as likely to live in poverty as children under age 3 who live in the five leading states. Black children are over 3 times as likely as White children to live in poverty, and Hispanic children have rates of child poverty that are more than twice the rate of White children.

Source: 2019 American Community Survey (ACS) 1-Year Public Use Microdata Sample (PUMS).
Note: Any data marked with an asterisk should be interpreted with caution.
OUTCOME MEASURE: CROWDED HOUSING
% children under age 3 living in crowded households
Median state value: 15.5%
Crowded housing is linked to housing instability and chaotic environments that impede healthy child development. Children living in the five lagging states on this indicator are 3 to 4 times more likely to live in crowded housing compared to children living in the five leading states. Rates vary considerably by race and ethnicity: More than one-third of Hispanic children under age 3 live in crowded housing, compared to nearly a quarter of Black children and 11.5% of White children.

Source: 2019 American Community Survey (ACS) 1-Year Public Use Microdata Sample (PUMS).
Note: Any data marked with an asterisk should be interpreted with caution.
OUTCOME MEASURE: FOOD INSECURITY
% households reporting child food insecurity
Median state value: 5.7%
Adequate nutrition is essential to promoting healthy development in infants and toddlers. Approximately 6.0% of children under age 3 lack food security, leaving them vulnerable to malnutrition and long-term health problems. In the five lagging states, more than 1 in 10 children is food insecure, and the rates vary considerably by race and ethnicity. Food insecurity among Black children under age 3 is 3 times greater than among White children, and Hispanic children are more than twice as likely as their White counterparts to be food insecure.

Source: 2018-2020 Current Population Survey (CPS), Food Security Supplement Public Use Microdata
Sample (PUMS).
Note: Any data marked with an asterisk should be interpreted with caution.
For additional information regarding calculation details, data quality, and source data please refer to Methods and Sources.
For more information on outcomes by goal, including by race and ethnicity and state, see the 2022 Prenatal-to-3 State Policy Roadmap section on outcomes across the US.
WHAT ARE THE MOST EFFECTIVE POLICIES AND STRATEGIES TO IMPACT SUFFICIENT HOUSEHOLD RESOURCES?
Based on comprehensive reviews of the most rigorous evidence available, the Prenatal-to-3 Policy Impact Center identified 11 effective solutions that foster the nurturing environments infants and toddlers need. For each of the five policies, the evidence points to a specific policy lever that states can implement to impact outcomes. For the six strategies, the evidence clearly links the strategy to PN-3 outcomes, but the current evidence base does not provide clear guidance on how states should implement each strategy to positively impact outcomes. Six policies and strategies have demonstrated effectiveness at supporting sufficient household resources.

For more information on the impact of state-level policies and strategies in the prenatal-to-3 period, search the Prenatal-to-3 Policy Clearinghouse for an ongoing inventory of rigorous evidence reviews. To learn more about the impact of effective policies and strategies on the eight prenatal-to-3 policy goals, see the Prenatal-to-3 State Policy Roadmap.
WHAT OTHER SOLUTIONS ARE STATES PURSUING THAT CAN HELP BUILD THE EVIDENCE BASE?
Beyond the policies and strategies proven effective by the current research, states also are pursuing other approaches that hold promise for improving sufficient household resources; these approaches have not yet accumulated enough rigorous research to enable drawing conclusions on their effectiveness, or the Prenatal-to-3 Policy Impact Center has not yet conducted a comprehensive evidence review for the approach. Other solutions states are pursuing that can help build the evidence base on sufficient household resources include, but are not limited :
- Child tax credits, which aim to increase household resources for families with children by providing a tax credit to help offset tax liability or provide a tax refund;
- Child care tax credits, which help subsidize child care expenses by providing a tax credit to reduce tax liability or provide a tax refund among families with children in which adults are working or attending school; and
- Unconditional cash transfers, which include the provision of cash (or “child allowances”) to families directly, without going through the tax system. Read more about the emerging positive findings of such cash transfers in our child allowance evidence review.
SOURCES
- Shonkoff, J. (2017). Breakthrough impacts: What science tells us about supporting early childhood development. YC Young Children, 72(2), 8-16
- Calculations were done by the Prenatal-to-3 Policy Impact Center using the 2019 American Community Survey (ACS), 1-Year Public Use Microdata Sample (PUMS)
- United States Department of Health and Human Services, Office of the Assistant Secretary for Planning and Evaluation. (2022). US federal poverty guidelines used to determine financial eligibility for certain programs. https://aspe.hhs.gov/topics/poverty-economic-mobility/poverty-guidelines
- National Academies of Sciences, Engineering, and Medicine. (2019). A roadmap to reducing child poverty. Washington, DC: The National Academies Press. https://doi.org/10.17226/25246
- Center on the Developing Child. (n.d.) Serve and return. https://developingchild.harvard.edu/science/key-concepts/serve-and-return/#:~:text=Serve%20and%20return%20interactions%20shape,of%20communication%20and%20social%20skills
- Center on the Developing Child. (n.d.) Neglect. https://developingchild.harvard.edu/science/deep-dives/neglect/
- Calculations were done by the Prenatal-to-3 Policy Impact Center using the 2019 American Community Survey (ACS), 1-Year Public Use Microdata Sample (PUMS)
- Altman, D. (2020). Coronavirus’ unequal economic toll. Axios. https://www.axios.com/coronavirus-economy-jobs-unemployent-racial-disparities-29e3c6c4-bb43-4eaf-bf90-04697ca66b2d.html
- Coleman-Jensen, A., Rabbitt, M. P., Gregory, C. A., & Singh, A. (2017). Household food security in the United States in 2016 (Economic Research Report No. 237). Washington, DC: US Department of Agriculture
- Alaimo, K. (2005.) Food insecurity in the United States: An overview. Topics in Clinical Nutrition 20(4): 281–298
- Gundersen, C., & Ziliak, J. P. (2014.) Childhood food insecurity in the US: Trends, causes, and policy options. The Future of Children 24(2): 1–19
- Solari, C. D., & Mare, R. D. (2012). Housing crowding effects on children’s wellbeing. Social Science Research, 41(2), 464–476. https:// doi.org/10.1016/j.ssresearch.2011.09.012
- Center on Budget and Policy Priorities (Sept. 10, 2021). Tracking the COVID-19 economy’s effects on food, housing, and employment hardships. Census Pulse Survey data from Aug. 18-30, 2021. Retrieved on Sept. 13, 2021, from https://www.cbpp.org/sites/default/files/8-13-20pov_0.pdf
